Counts over time
You have counts per week from a surveillance programme, or of mutations per passage from an evolution experiment, and perhaps an estimate over the same time: a reproductive number, a population size.
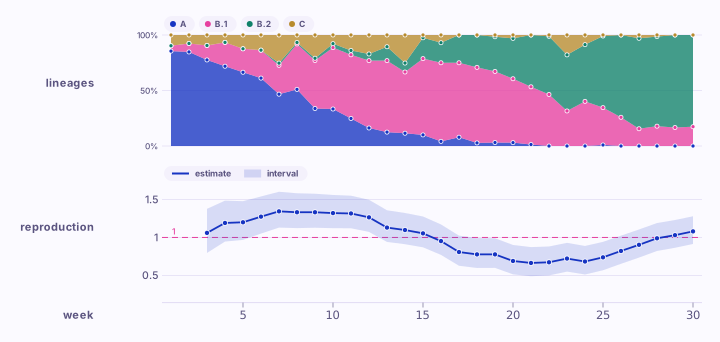
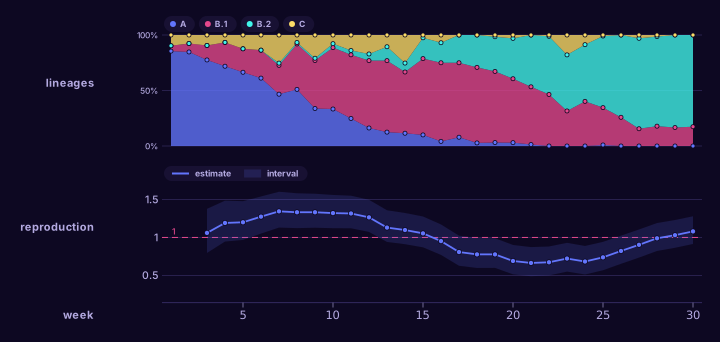
No place is named: the tables are their own place, and the ruler counts their weeks. Each week's lineages fill the band to 100%, and under them is the estimate with its interval and a dashed line at 1.
Your tables
One row per group per time, under a header:
The columns are found by their names: the time as week, day, month,
year or time, the group as lineage, mutation or variant, then count
and total. The estimate is a time, a mean, median or estimate, and
lower and upper where there is an interval. Tabs, commas or spaces separate
the columns. A time is a number of weeks, days, months or years, as week 12 or
year 2015; a skyline in decimal years, as BEAST writes one, is drawn as the
continuous time it is, to a thousandth of a year.
Change it
| To | Write |
|---|---|
| A line per group, each read against the whole | --style line after the counts |
| Some of the weeks | week:10-30 as the place, before the files |
| A population size on a log scale | --phylodynamics skyline.tsv --log |
| Only the counts, or only the estimate | leave the other file out |
The example files: lineages.tsv and
reproduction.tsv. Every option:
karyon help frequencies and karyon help phylodynamics, or the
command line reference.