An association scan
You have a table from an association tool: PLINK, PLINK 2, REGENIE, SAIGE, GEMMA, BOLT-LMM or the GWAS Catalog.
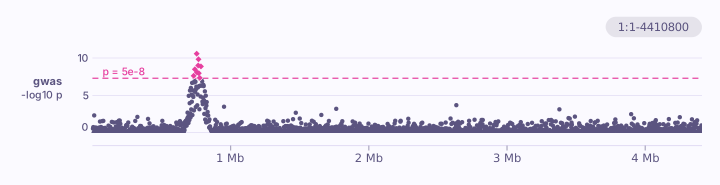
The place, 1, is the chromosome as the table names it. Each marker is as
high as -log10 of its p-value, and the dashed line is p = 5e-8.
Change it
| To | Write |
|---|---|
| Zoom into the peak | 1:700,000-820,000 in place of 1 |
| Draw the line elsewhere | --threshold 1e-5 |
| Add the genes under the peak | NC_000962.3:700,000-820,000 gwas.assoc --threshold genome-wide genes.gff3 --rename 1=NC_000962.3 |
--rename is for a table that names the chromosome 1 where the annotation
calls it NC_000962.3.
Every chromosome at once
With no place, the table is drawn across every chromosome it names, end to end, in the order they are counted, each named under the scan:
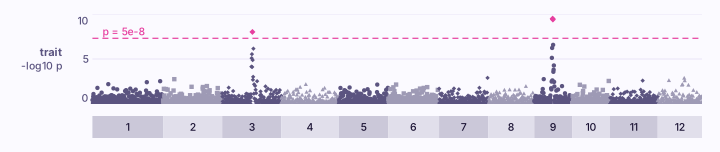
Each chromosome is as long as its furthest marker, since a table says where
its markers are and not how long the chromosomes run, and the shades alternate
so a tower is read against the chromosome it stands on. Name one to draw it
alone, as karyon 3 trait.assoc.
Colour a peak by linkage
Zoomed into the peak, each marker coloured by its linkage with the strongest, as LocusZoom draws one, with the recombination rate laid over it:
karyon 1:661,000-861,000 gwas.assoc --ld lead.ld --threshold genome-wide \
  --with-recombination genetic_map.txt -o locus.svg
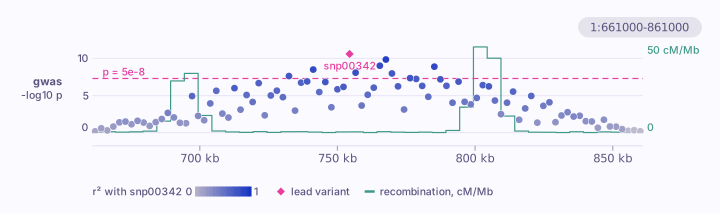
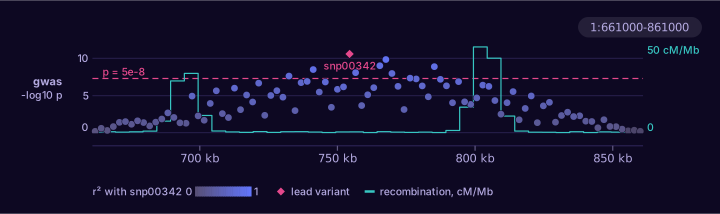
lead.ld is PLINK's linkage of the lead with its neighbours, as
plink --r2 --ld-snp snp00342 --ld-window-kb 100 --ld-window 99999
--ld-window-r2 0
writes it, and the lead is called by the name the scan gives
it. genetic_map.txt is a genetic map as HapMap writes one, laid over the
scan by --with-recombination and read off the scale on the right; named on
its own, it is drawn as a track of its own under the scan instead.
The example files: gwas.assoc,
trait.assoc, lead.ld and
genetic_map.txt. Every option:
karyon help manhattan, or the command line reference.