Variation and association
Plots for calls and the patterns they make across samples: point and structural variants, the genotypes of a cohort, copy number, variable sites, genotype matrices and heatmaps, association scans, linkage and other pairs, and site-wise selection.
How to choose
Choose by what carries the result: one position, two breakpoints, a fitted segment, a variable column, a cell for each sample and site, or one test per position.
| Your question | Plot | Build it with |
|---|---|---|
| Where are the calls, and how strong is each one? | Point variants | VariantTrack, --variants |
| Which two positions does a rearrangement join? | Structural variants | StructuralTrack, --structural |
| How many copies are there, and has one allele been lost? | Copy number | CopyNumberTrack, --copy-number with --ploidy |
| Which sites tell closely related samples apart? | Variable sites | SnpTrack, --snps |
| Which call does each sample carry, from a VCF? | Genotypes by sample | GenotypeTrack, --genotypes |
| Which samples carry what, site by site? | Genotype matrix | MatrixTrack, --matrix |
| Which samples lost or gained a stretch, window by window? | Heatmap of samples | MatrixTrack::windows, --heatmap |
| Where does a scan cross its significance line? | Association scan | ManhattanTrack, --manhattan |
| Which markers of a peak travel with its strongest? | Scan coloured by linkage | ManhattanTrack::linkage, --manhattan with --ld |
| Which variants are inherited together, or which places are in contact? | Pairs of positions | PairTrack, --pairs |
| Which codons are under selection, and in which direction? | Site-wise selection | SelectionTrack, --selection |
Plots
-
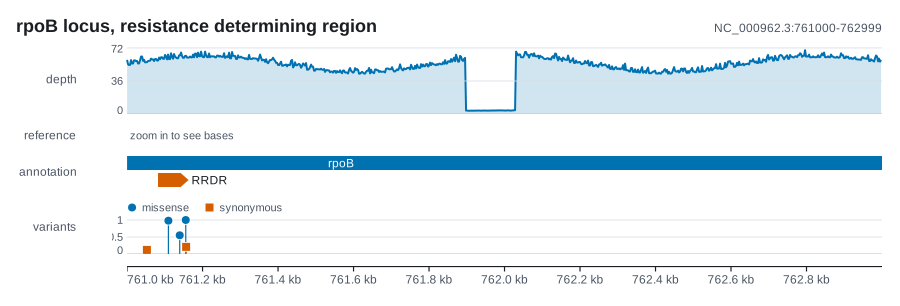
Point variants Point events as lollipops whose height is a value, or as plain ticks when there are too many for heads, with categories coloured in the order they first appear.
-
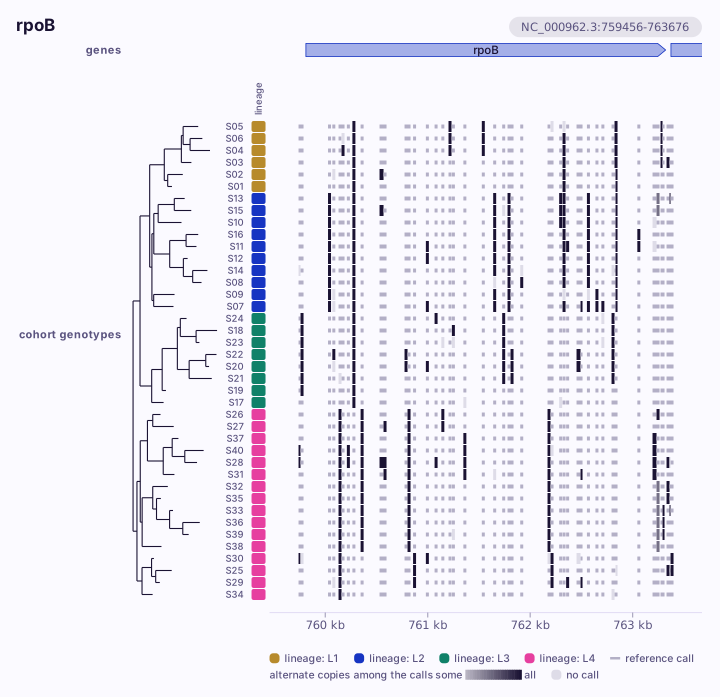
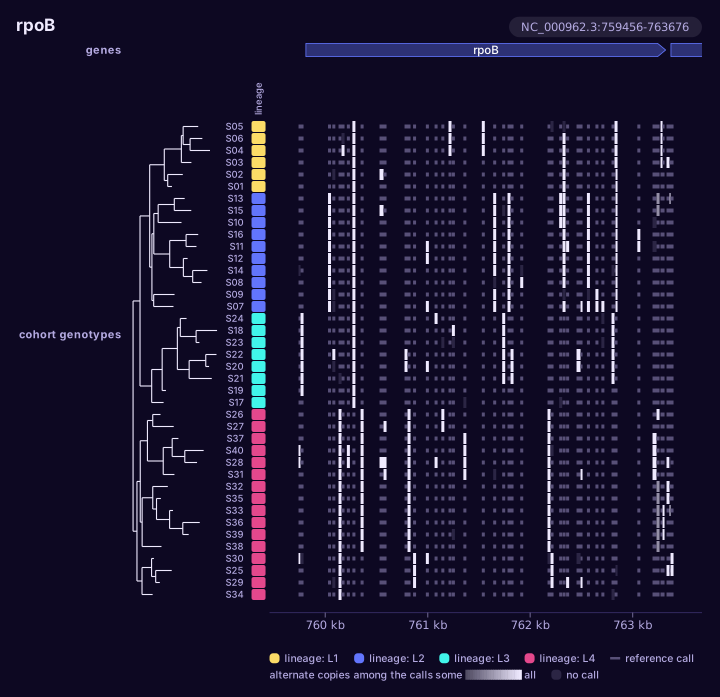
Genotypes by sample The call of each sample at each site of a VCF, a row per sample and each call at its position, with sites closer than a cell pooled a pixel at a time.
-
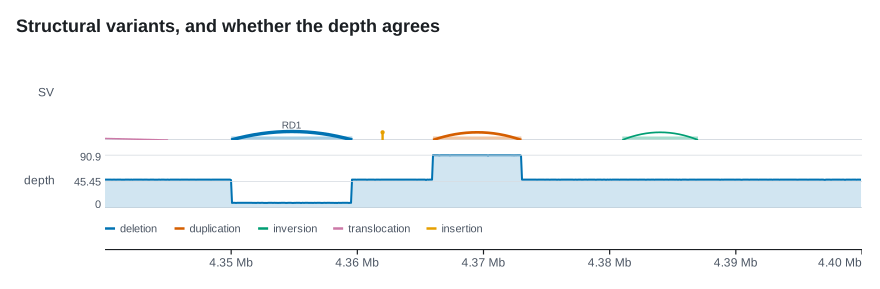
Structural variants Each call as an arc between its two breakpoints, heavier with more supporting reads; a coverage track beneath shows whether the depth agrees.
-
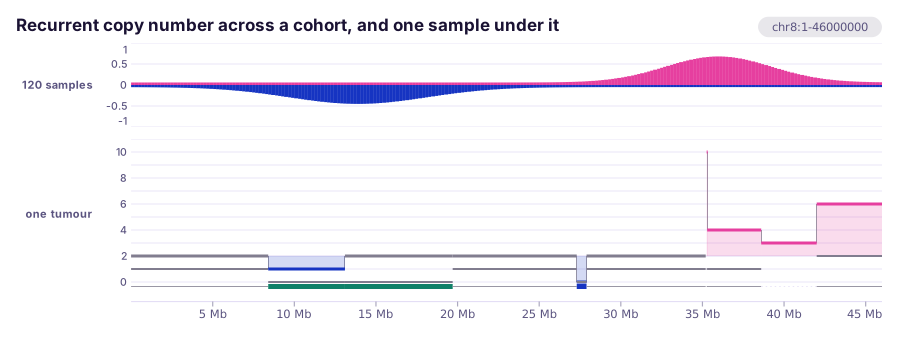
Copy number Fitted segments drawn at their level on a ladder of whole copies, loss of heterozygosity in a lane of its own, and balanced wherever you say it is.
-
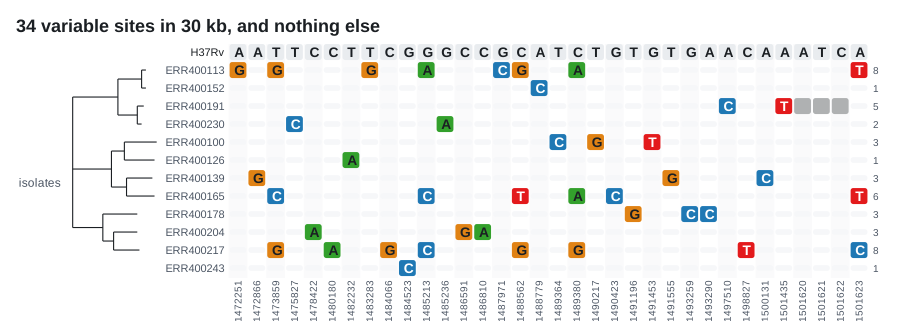
Variable sites Only the columns that vary, evenly spaced and each labelled with its position; a tree beside the rows lines a clade's shared changes up into a block.
-
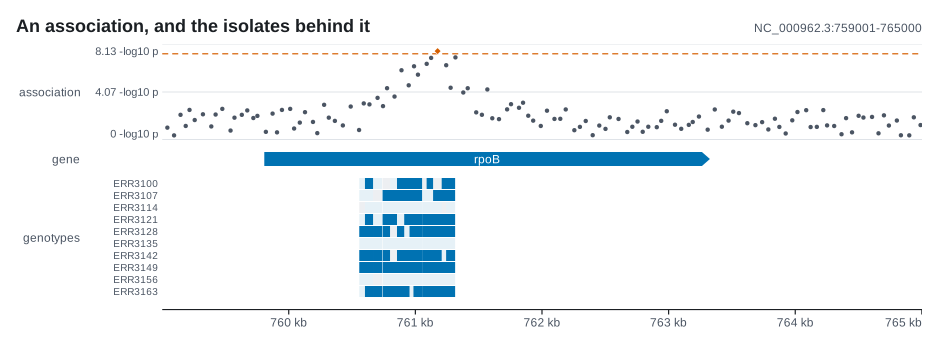
Genotype matrix One row per sample and one cell per site at its real coordinate, where a sample without the allele, a sample never typed and a stretch with no site all look different.
-
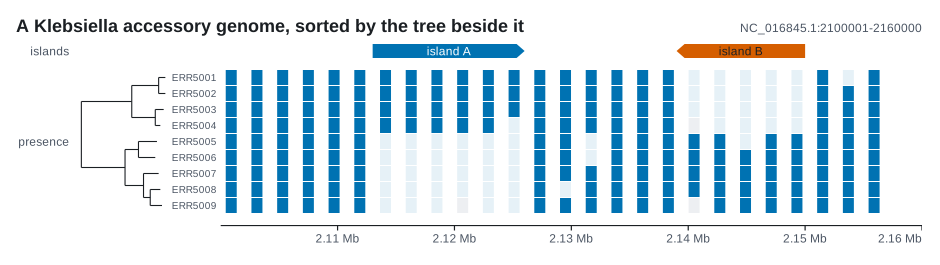
Presence and absence by descent The same matrix sorted by a tree drawn beside it, which turns a speckle into blocks a clade carries.
-
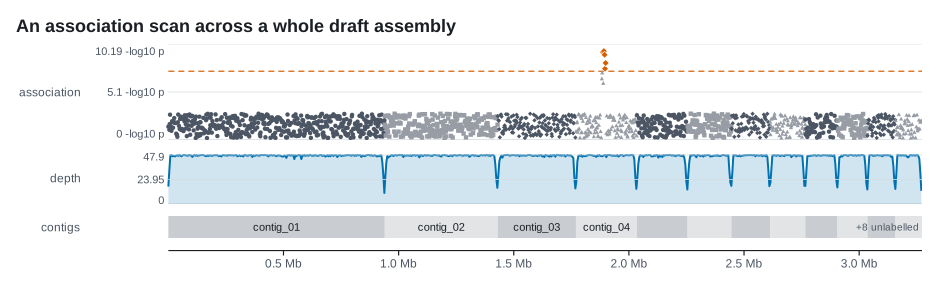
Association scan One point per test, a threshold you set and the points above it ringed; laid over a
Genome, the scan runs across a whole assembly. -
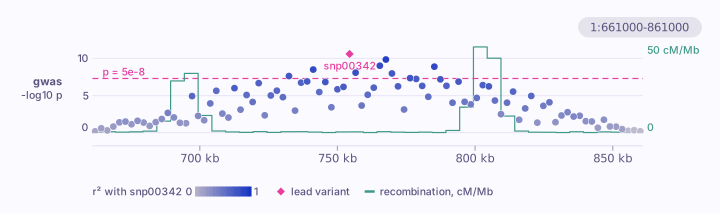
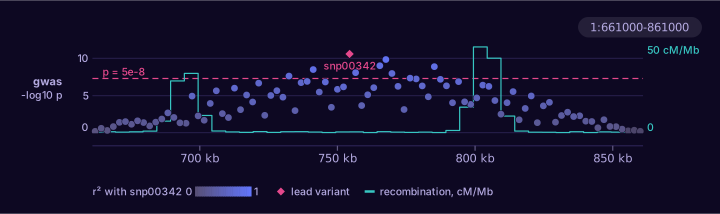
Scan coloured by linkage A peak as LocusZoom draws one: every marker coloured by its r² with the lead, so a second signal beside the first stands out grey.
-
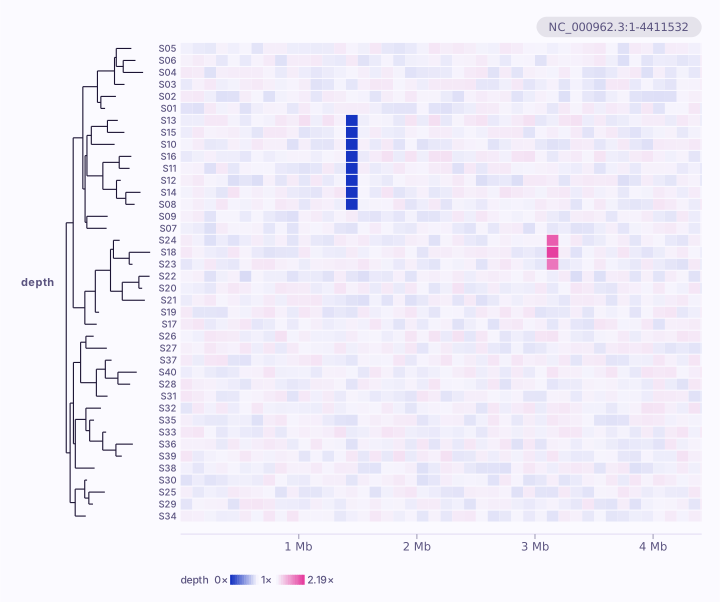
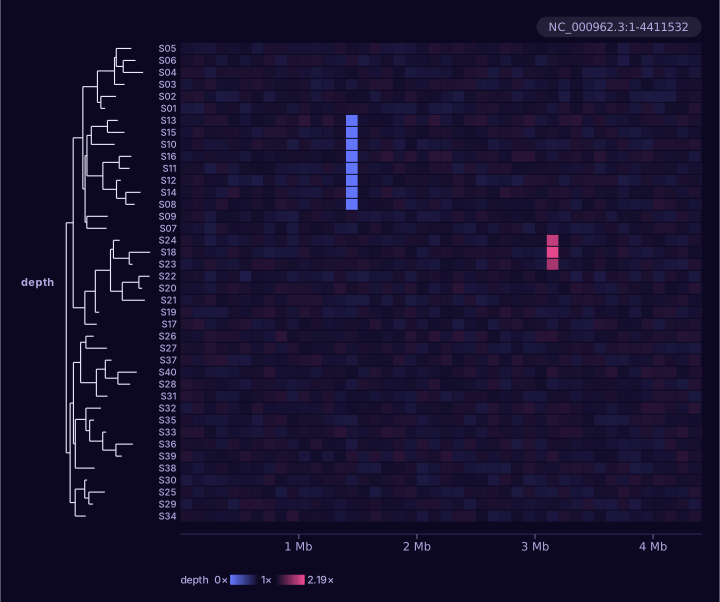
Heatmap of samples A value per sample per window, each sample read against its own usual value, in the order of a tree.
-
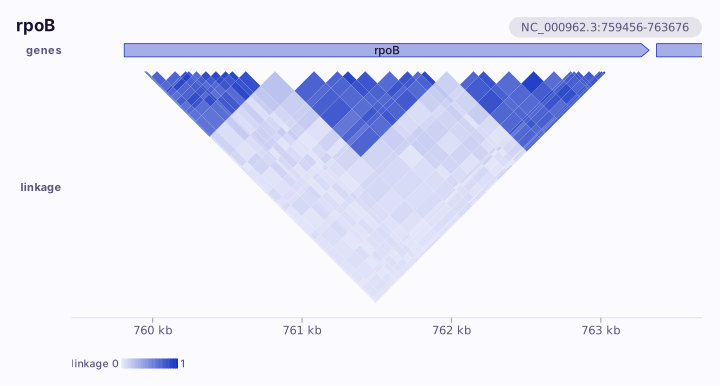
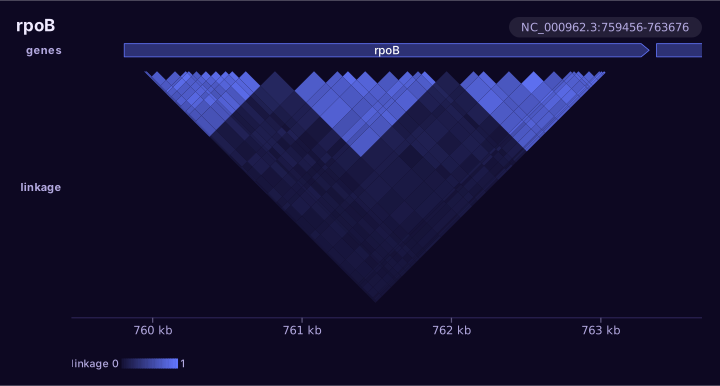
Pairs of positions Linkage or contacts as a triangle hung under the axis, and a few pairs far apart as arcs.
-
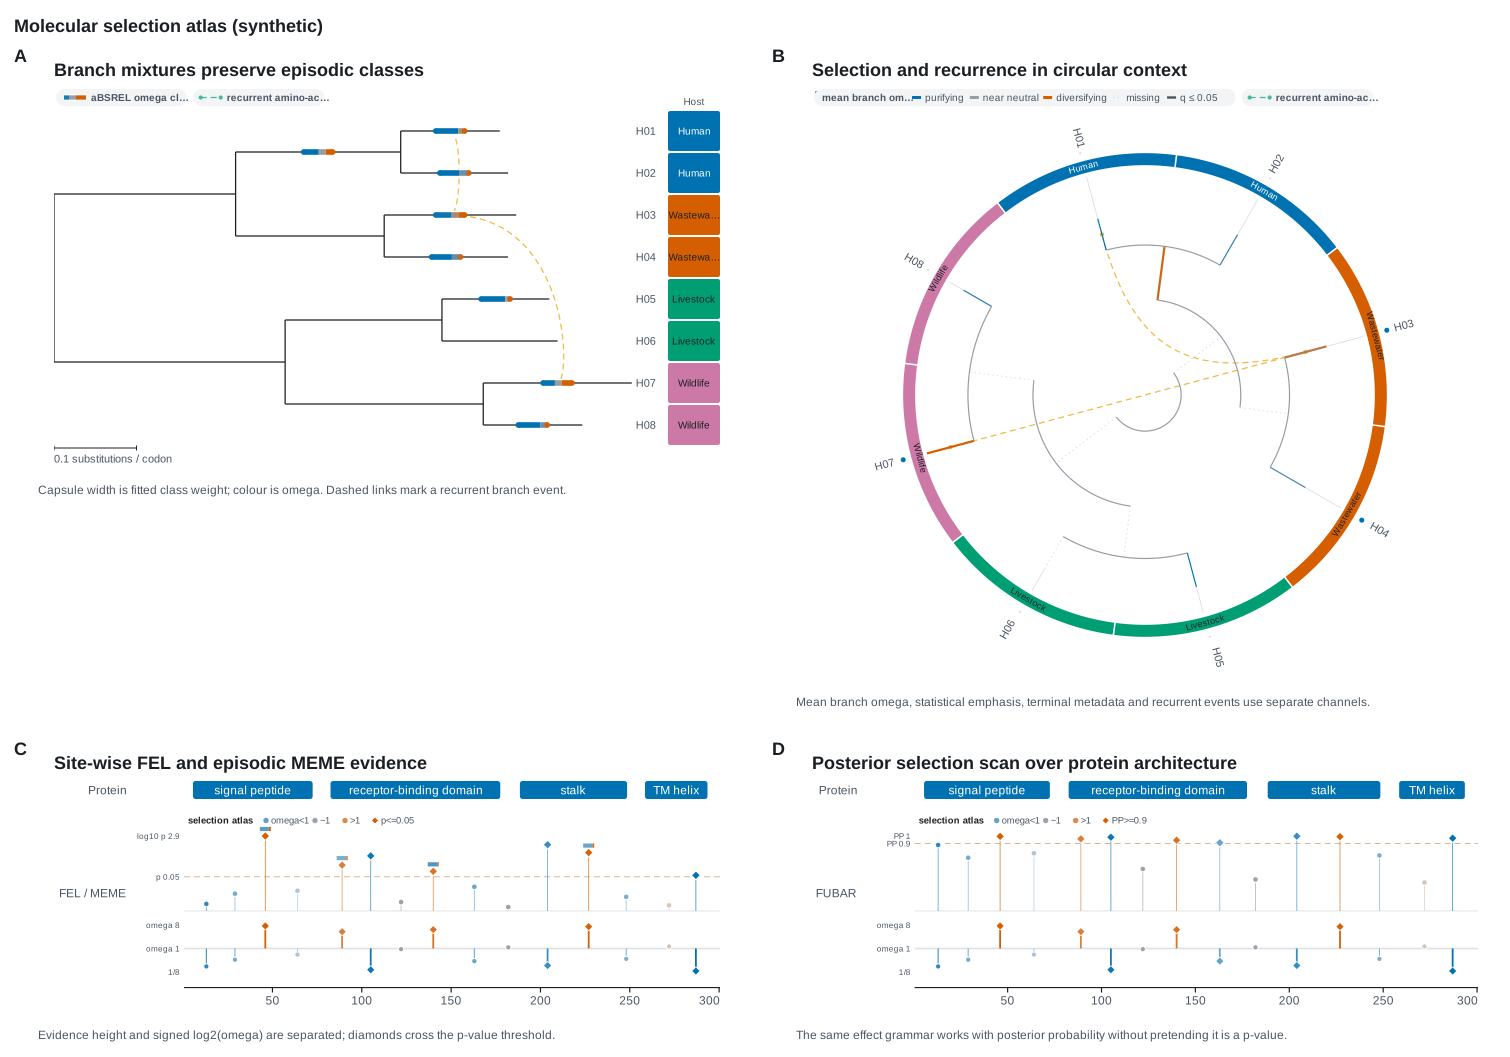
Site-wise selection Evidence, as a p-value or a posterior, in one tier and the signed log2(ω) effect in another, so a significant purifying site still reads as purifying.
Related
-
The reads and molecules behind a call.
-
Calls read on a tree, and spans painted onto the clades that carry them.
-
The genes and codons a call lands in.
-
A whole assembly laid end to end under a genome-wide scan.