Reads and molecules
Plots that keep the evidence one molecule at a time, before reads are collapsed into depth, a call or an average per site.
How to choose
| Your question | Plot | Build it with |
|---|---|---|
| Does a call hold up in the reads behind it? | Read pileup | PileupTrack, --pileup |
| Did one molecule align to several places, and in what order? | Split reads | SplitReadTrack, --split-reads |
| Are the methylated sites on the same molecules, or scattered across them? | Methylation by molecule | BisulfiteTrack, --bisulfite |
| How many reads crossed each intron? | Splice junctions | JunctionTrack, --junctions |
| What did the current look like before basecalling? | Nanopore signal | SquiggleTrack, --squiggle |
Plots
-
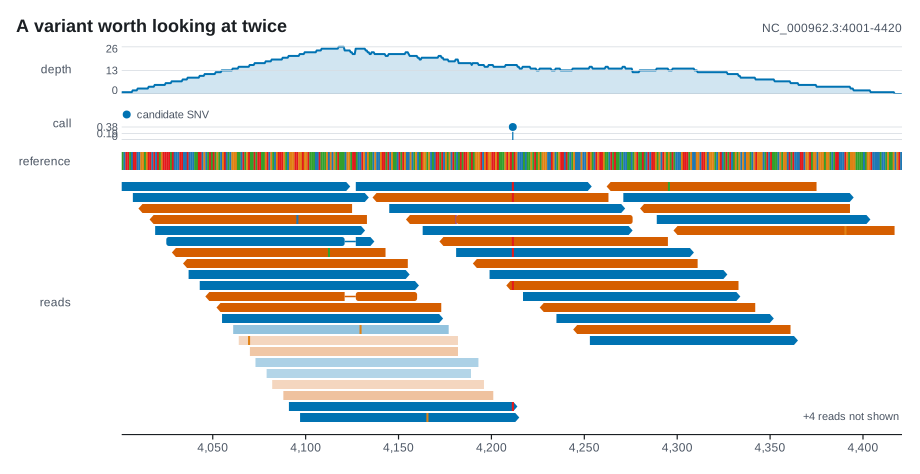
Read pileup Reads placed by their real CIGAR and packed into rows, with mismatches found against the reference and the reads past the row limit counted on the band.
-
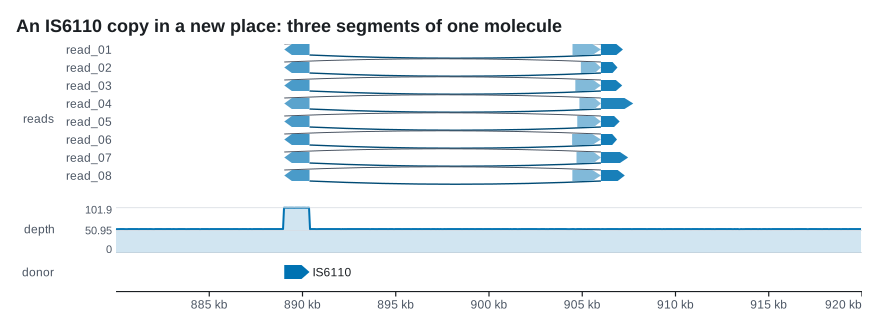
Split reads One row per molecule and one bar per alignment, joined in the order the molecule ran, with any step back down the reference drawn under the row.
-
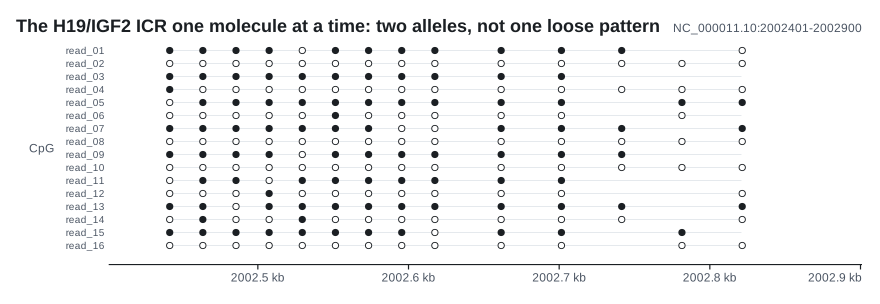
Methylation by molecule One row per read, a filled circle where a site is methylated, an open one where it is not and nothing where the read did not reach, so two alleles show as stripes.
-
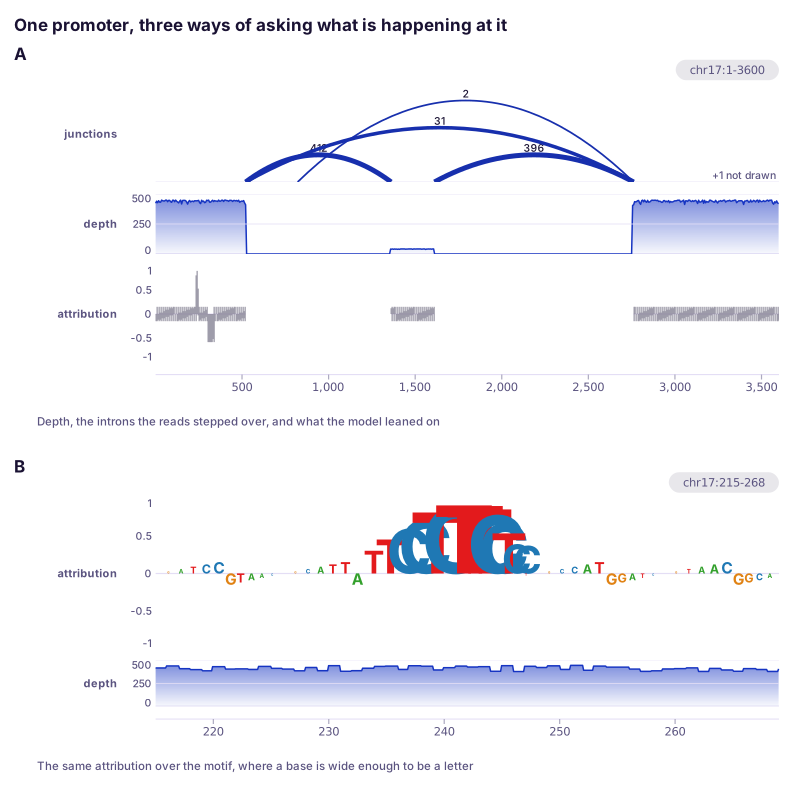
Splice junctions One arc per intron, weighted and labelled by the reads that crossed it; arcs sit in lanes, so their height means nothing.
-
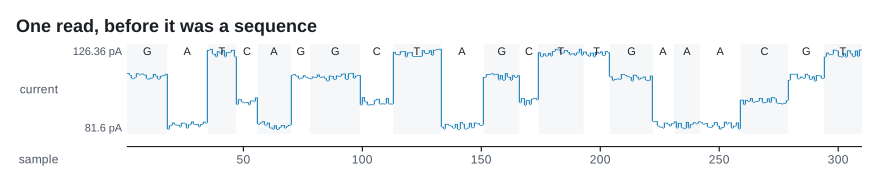
Nanopore signal Raw current against sample number, an envelope of the extremes when zoomed out and the samples themselves when zoomed in; a move table adds the called bases.
Related
-
After the reads have become depth or a methylated fraction per site.
-
After the evidence has become a call.
-
BAM and SAM and its
SAtag, STAR junction tables and Bismark extractor files, and how a CRAM comes in throughsamtools. -
Complete programs that stack several tracks into one figure.