Phylogeny and clades
Plots that put a tree beside the evidence: annotated trees in several layouts, two trees face to face, genomic spans painted onto clades, and a tree around a map. karyon draws the tree you give it; it does not infer one.
How to choose
| Your question | Plot | Build it with |
|---|---|---|
| What does the tree say, with its support and metadata beside it? | Annotated tree | TreeTrack, --tree |
| Where do two trees over the same taxa disagree? | Tanglegram | TanglegramTrack, --tanglegram with --against |
| Which clades carry a genomic span, and is it one event? | Clade blocks | CladeTrack, --clades with --with-tree |
| Where were the tips sampled? | Tree around a map | PhyloMap, Rust only |
To sort rows of sites, genes, residues or domains by a tree, hand the tree to
SnpTrack, MatrixTrack, MsaTrack or DomainTrack with .tree(): their
plots are under variation and
comparisons.
Plots
-
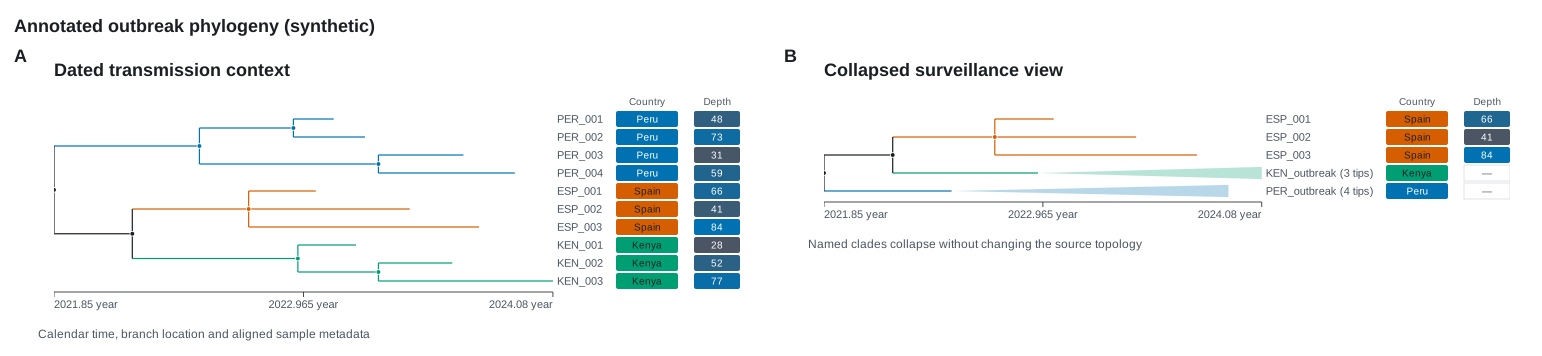
Annotated tree A phylogram, cladogram or time tree with metadata aligned to its tips, branches coloured by a trait and clades collapsed without changing the tree.
-
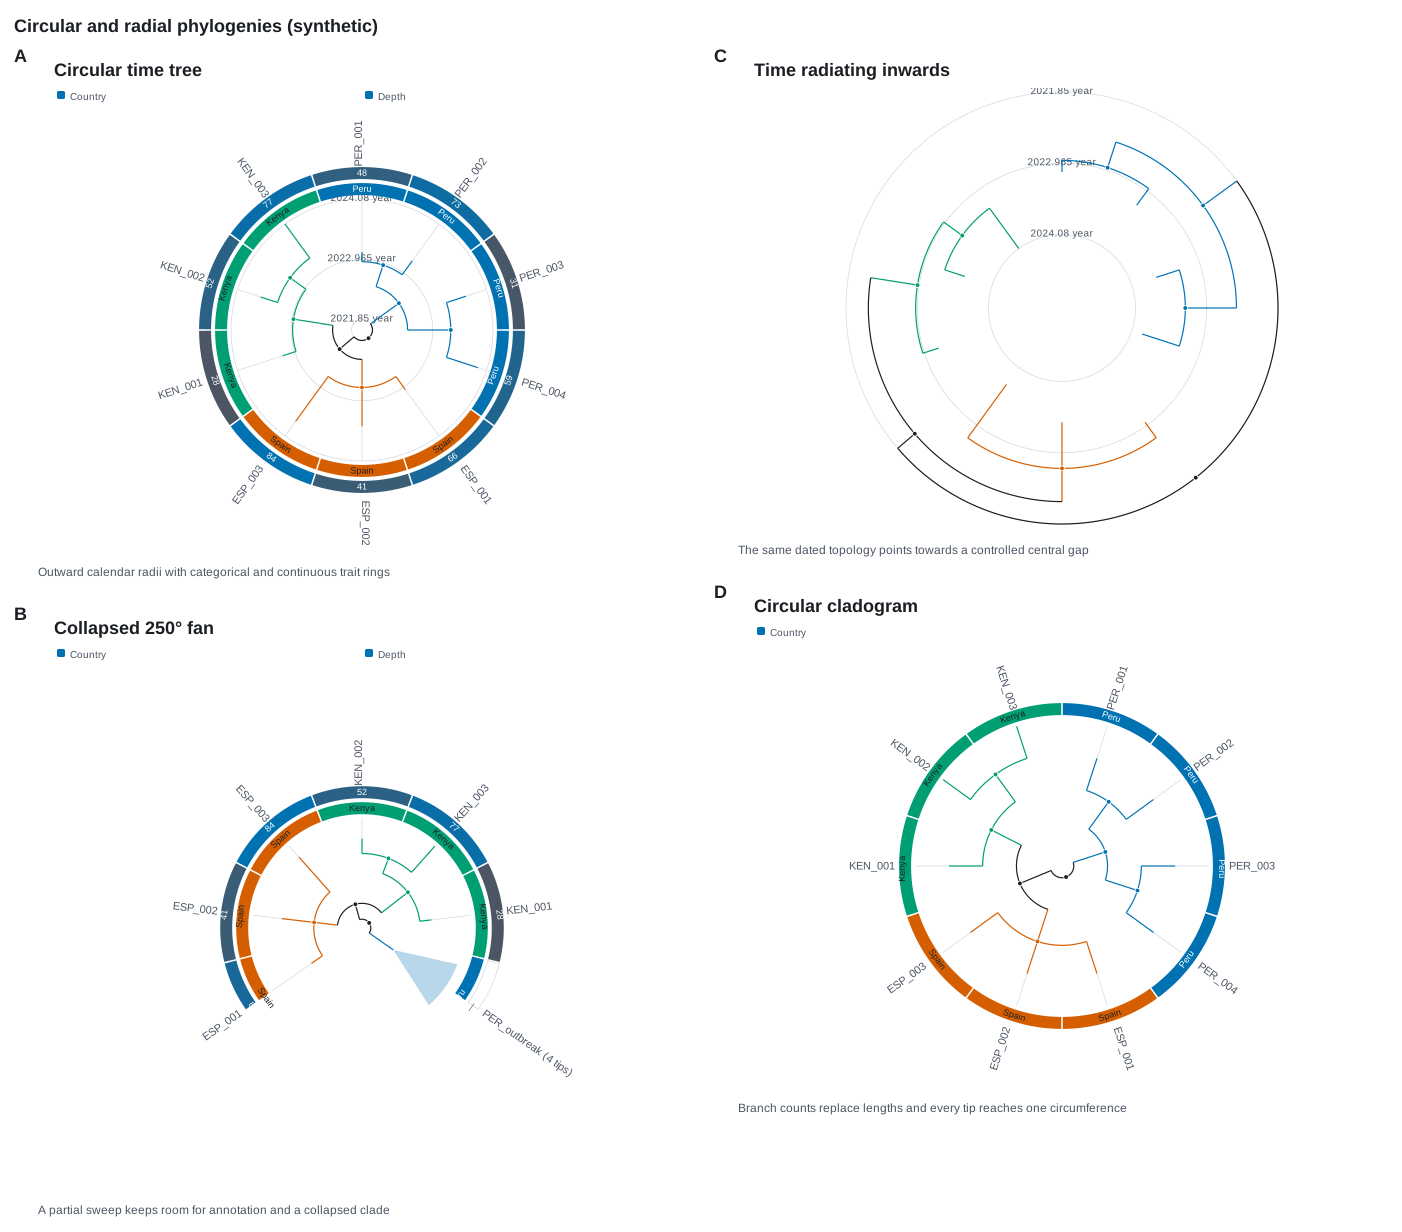
Circular and radial trees The same tree as a full circle, a partial fan or radiating inwards, with metadata as rings; the topology and the order of the tips stay the same.
-
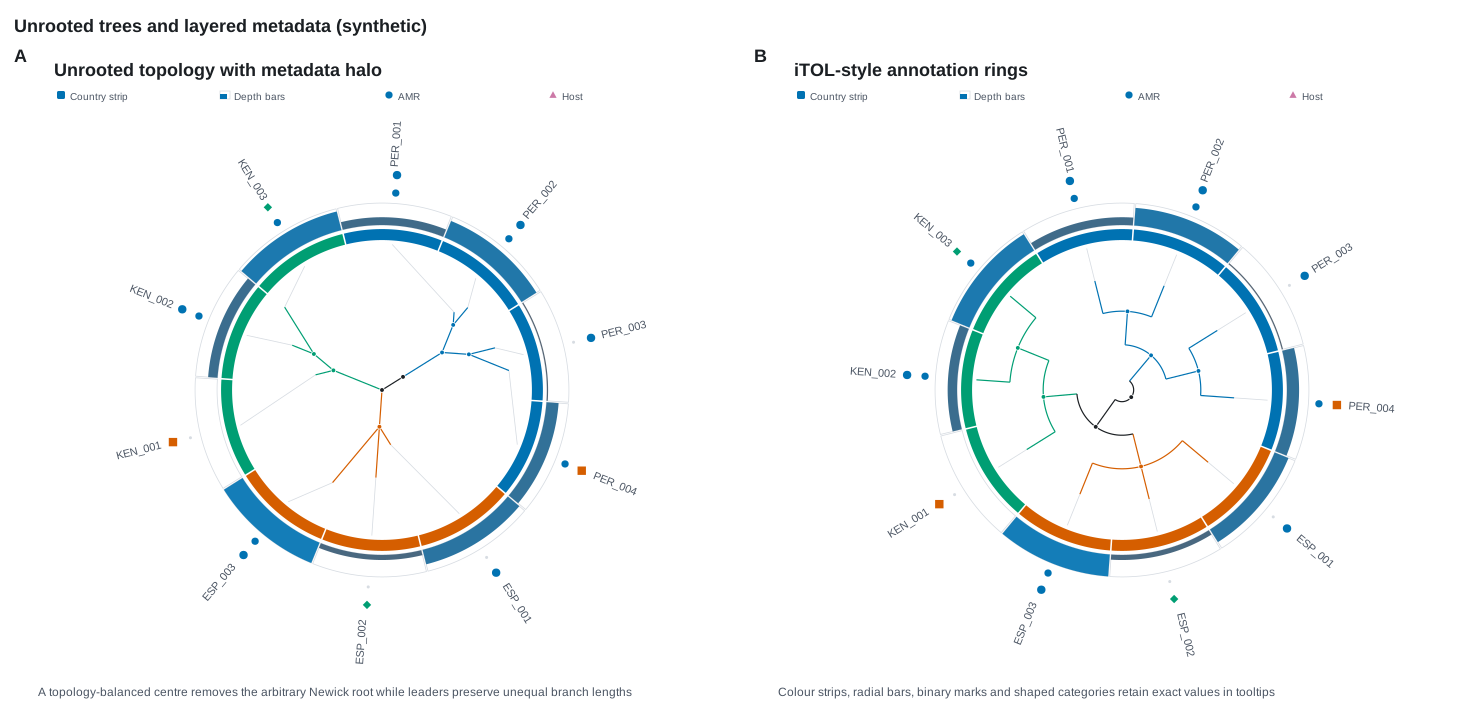
Unrooted trees and datasets An unrooted layout centred on the topology rather than on the root the file happened to use, with strips, bars, binary marks and symbols as datasets.
-
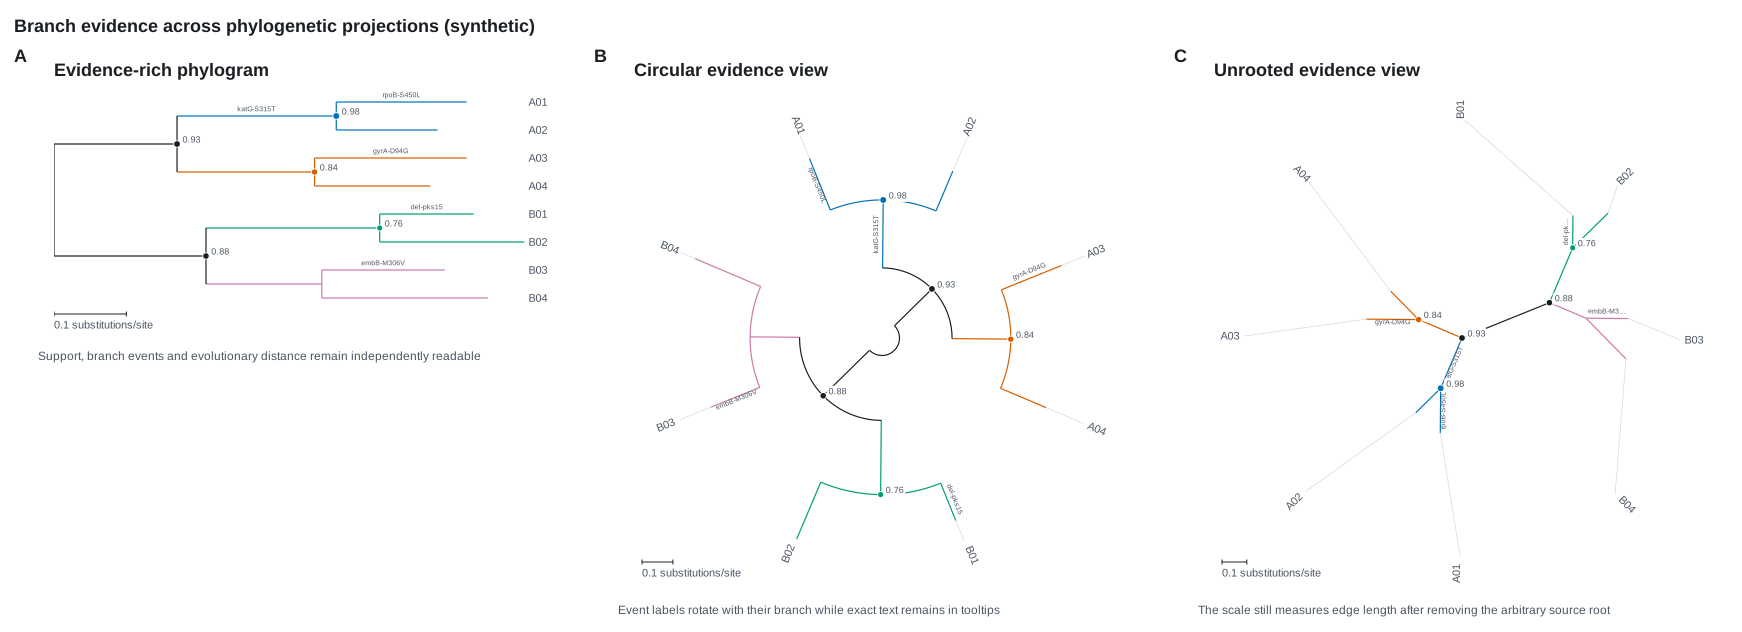
Support, events and scale bars Support as symbols or labels above a threshold, each branch's own events written along it, and a scale bar in branch-length units.
-
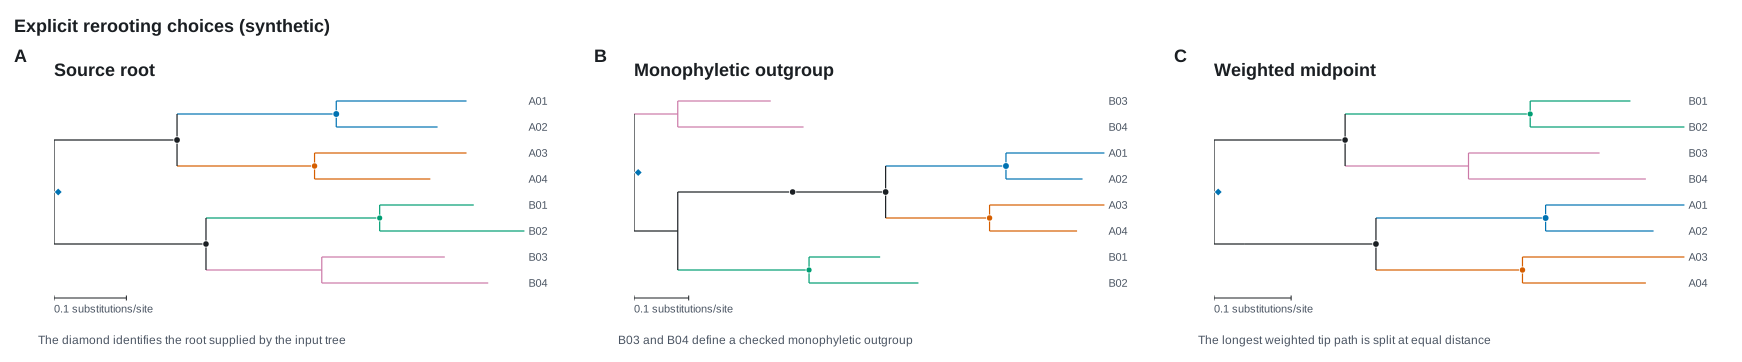
Rooting choices Reroot at a node, on an outgroup checked for monophyly or at the midpoint, with the new root marked.
-
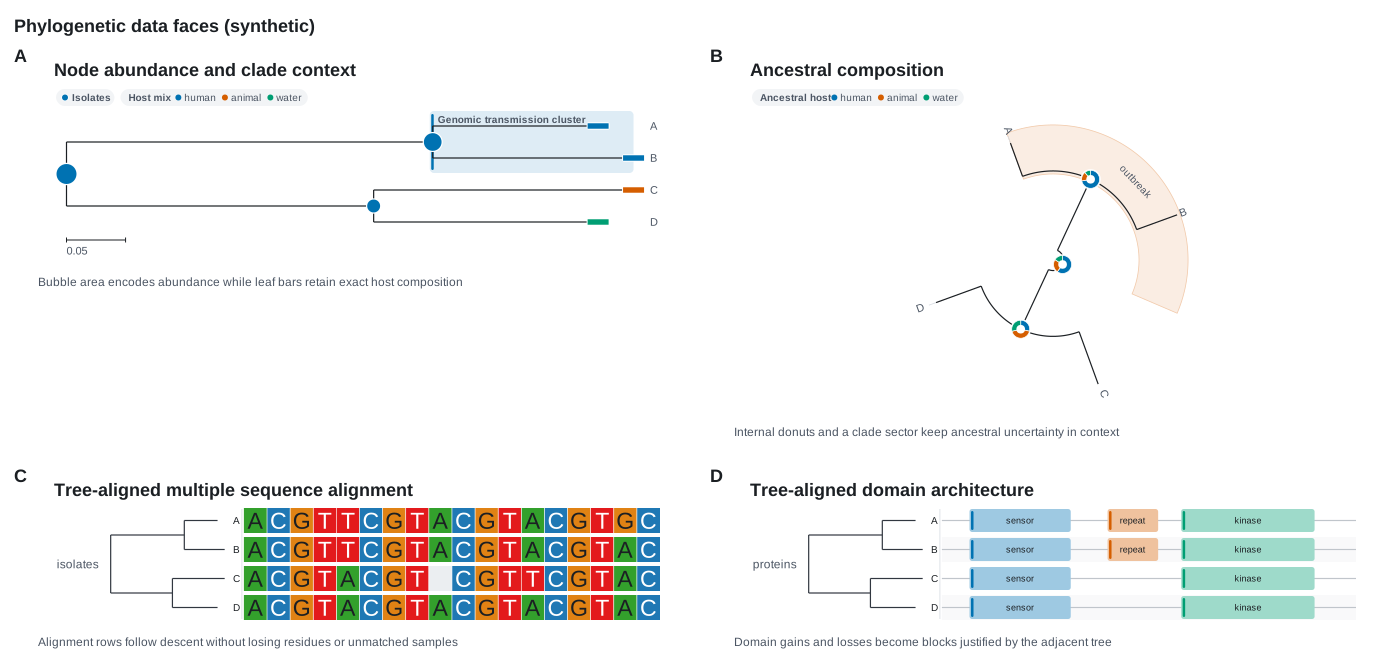
Node glyphs and clade highlights Bubbles, pies, donuts or stacked bars on nodes and a band or sector behind a clade; a missing value draws no glyph rather than a zero.
-
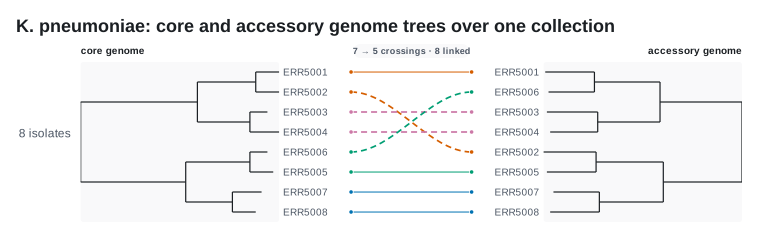
Tanglegram Two trees facing each other with every shared tip joined; untangling rotates clades to remove crossings but never changes either tree.
-
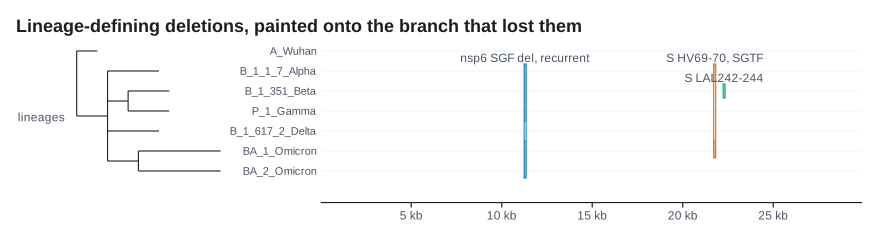
Clade blocks A genomic span painted across the clade that carries it, with any row inside the span that does not carry it cut out, so a scattered set never passes for a clade.
-
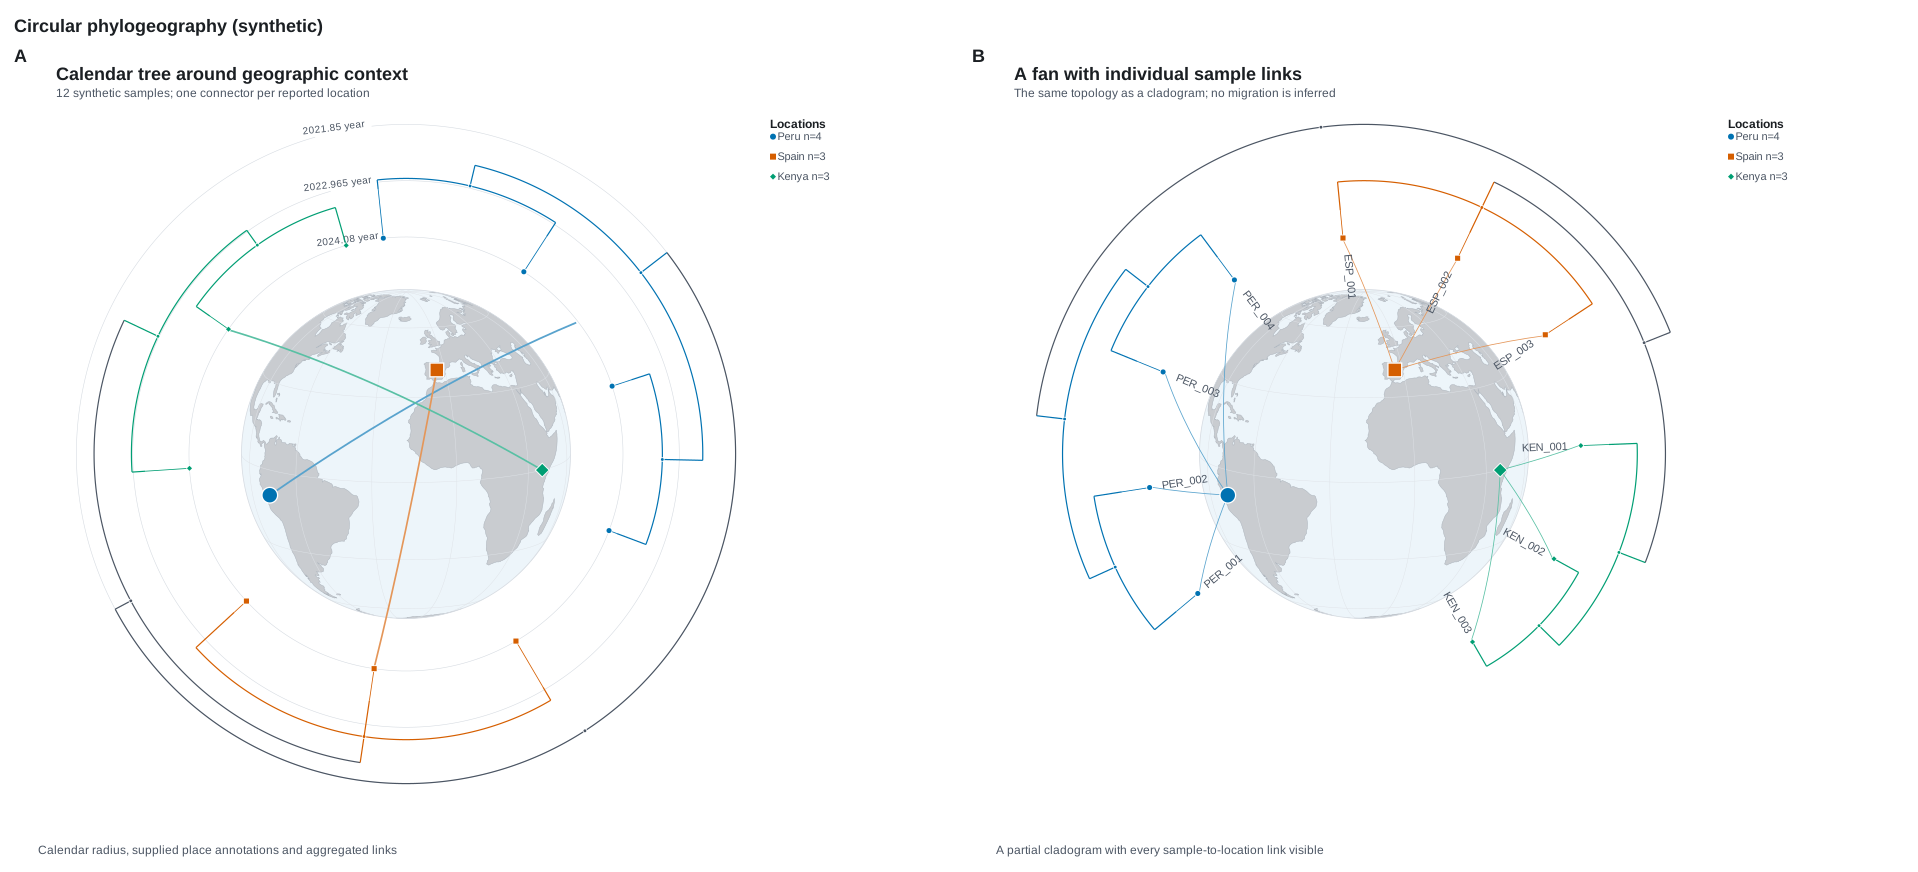
Tree around a map A circular tree framing a map, its tips linked to the locations you supply, place by place or sample by sample; nothing about migration is inferred.
Related
-
Ancestral states and selection on the same trees, and trajectories and lineage counts through time.
-
Variable sites and genotype matrices sorted by a tree.
-
Reading trees and their annotations, dates, layouts, rooting and collapsing.
-
Open a tree in the browser and explore it, from a handful of tips to a million.