Signal and sequence
Plots for a value or a symbol at every position: read depth, a statistic in windows, methylation by strand, the reference bases, sequence logos and per-base model attribution.
How to choose
Decide first what zero means for your values: the floor they rise from, as for depth; a line they fall either side of, as for a statistic in windows; or nothing at all, as for bases and letters.
| Your question | Plot | Build it with |
|---|---|---|
| How much is there at each base, counting up from zero? | Coverage | CoverageTrack, --coverage |
| Which side of its baseline does each window fall on? | Windowed statistic | WindowTrack, --windows |
| How methylated is each site, strand by strand? | Methylation by strand | MethylationTrack, --methylation |
| What are the reference bases here? | Reference sequence | SequenceTrack, --sequence |
| What does a motif look like across aligned sequences? | Sequence logo | LogoTrack, --logo |
| Which bases did a model rely on, and in which direction? | Per-base attribution | DynseqTrack, --dynseq with --with-sequence |
Plots
-
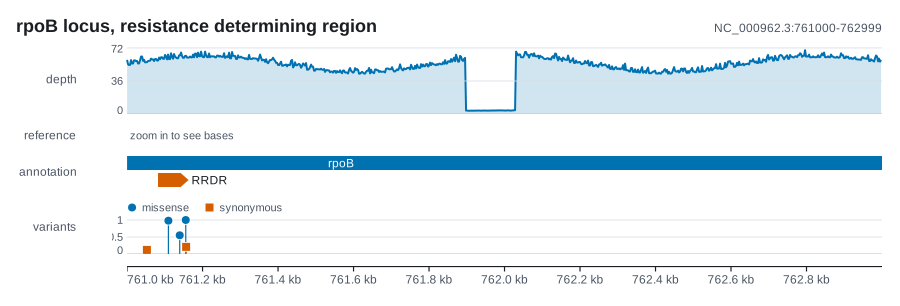
Coverage One value per base drawn up from a floor of zero, each pixel column showing its maximum, or its minimum when you are hunting dropouts.
-
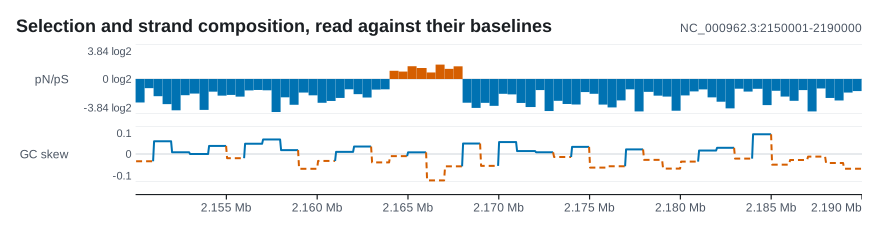
Windowed statistic A statistic per window drawn either side of the line it is read against, such as pN/pS, GC skew or Tajima's D.
-
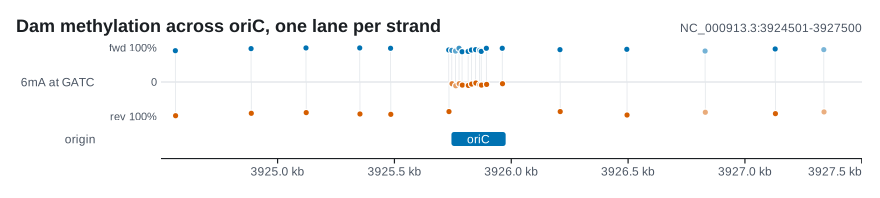
Methylation by strand The methylated fraction at each site with each strand in its own lane, calls from too few reads dropped and counted, and the rest faded by depth.
-
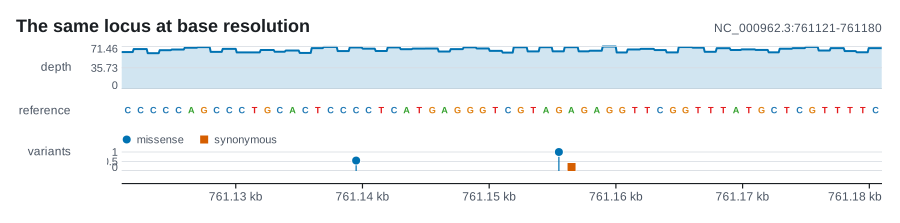
Reference sequence The bases as letters when there is room, coloured blocks when there is not, and a prompt to zoom in once they are too thin to draw.
-
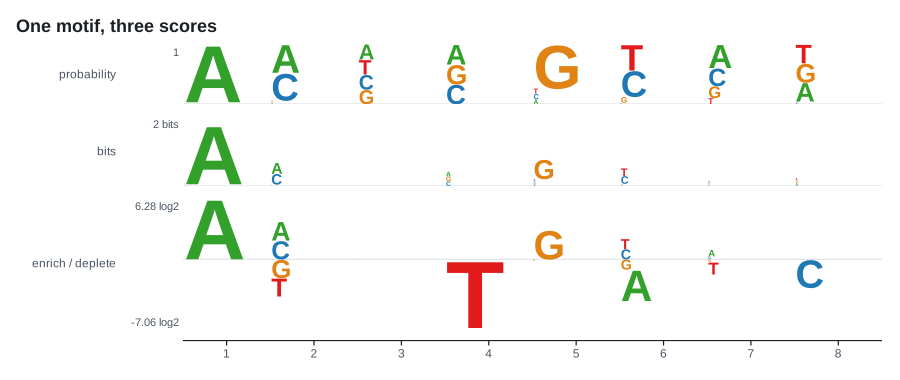
Sequence logo A motif from aligned sequences or a weight matrix, scored as probability, information or enrichment against a background, with depletion hanging below the line.
-
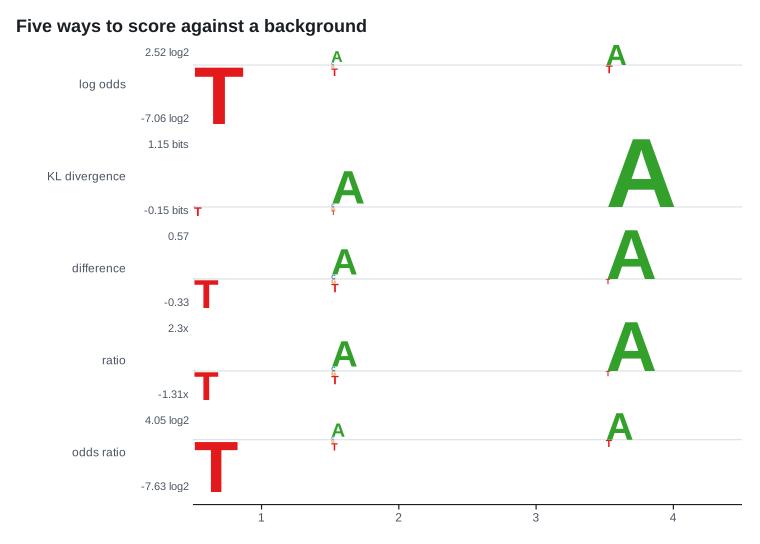
Logo scores compared Seven scores to choose from, and the choice decides which column reads loudest, not only how the logo looks.
-
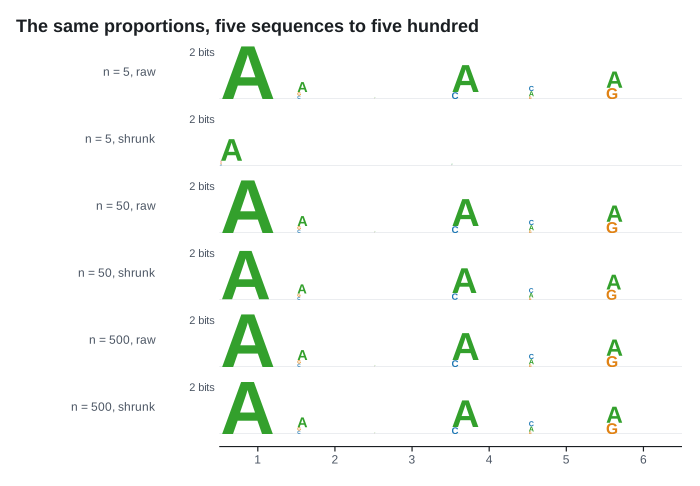
Stabilised logo Each column shrunk towards the background, more when it rests on fewer sequences, so five sequences do not look as certain as five hundred.
-
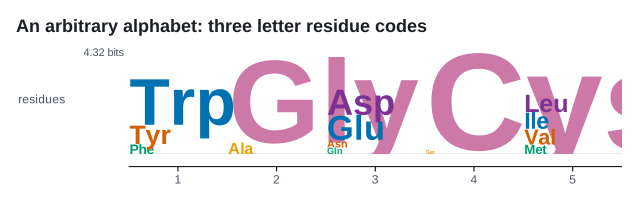
Logo of any alphabet Symbols are strings, so three-letter residue codes and k-mers stack the way bases do.
-
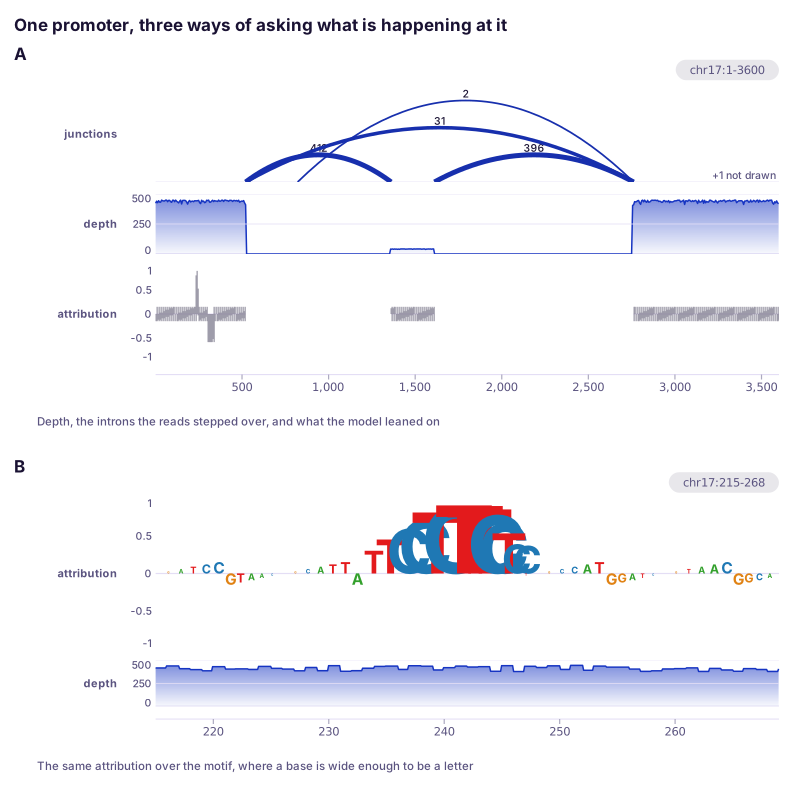
Per-base attribution One signed score per base drawn as the base itself: tall where the model relied on it, hanging below the line where it pulled the prediction down.
Related
-
Methylation one read at a time, raw nanopore current, and the reads behind a depth profile.
-
When a position carries a call rather than a value.
-
Genes, reading frames and rulers to put under a signal.
-
What bedGraph,
samtools depthand bedMethyl are read as, and which convention each one counts positions in.