Evolution and surveillance
Plots for results fitted upstream: ancestral states, selection on branches and at sites, population trajectories and lineage counts through time. karyon draws each one with its uncertainty in view; it fits none of the models.
How to choose
| Your question | Plot | Build it with |
|---|---|---|
| What state was each ancestor in, and where did it change? | Ancestral states and branch events | TreeTrack with AncestralStateLayer, BranchEventLayer and BranchIntervalLayer |
| On which branches is ω above or below one? | Selection on branches | TreeTrack with .dnds(), BranchRateMixture and HomoplasyLayer |
| Which codons are under selection, and in which direction? | Site-wise selection | SelectionTrack, --selection |
| How did the effective population size or R change through time? | Phylodynamic trajectory | PhylodynamicTrack, --phylodynamics |
| Which lineages are rising, and out of how many samples? | Lineage surveillance | SurveillanceTrack, --frequencies |
The first two are built in Rust: the command line draws the tree itself with
--tree, but not these layers. The last three read a table each. To compare two trees, see the
tanglegram.
Why karyon draws these results but fits none of them
Each of these results is an estimate that another program made, and each plot keeps the estimate apart from its uncertainty and from what was observed. A missing value stays missing rather than becoming zero.
| You supply | karyon draws | karyon does not |
|---|---|---|
| Ancestral state probabilities | Donuts on internal nodes, and a mark where a confident state changes | Reconstruct ancestral states |
| Events on a branch | Ordered symbols on that branch, and dashed curves between branches carrying the same event | Infer events, or claim convergence |
| An estimate with bounds | A whisker on a branch, or a ribbon through time | Estimate the interval |
| Branch or site ω | Colours centred on ω = 1, capsules for rate classes, evidence in a tier of its own | Fit a codon model |
| Effective size, R or growth through time | A line on a linear or log scale | Fit a coalescent model or a clock |
| Lineage counts and totals | Stacked composition or lines, with alerts that state their reason | Smooth, extrapolate, or fill a missing count with zero |
Plots
-
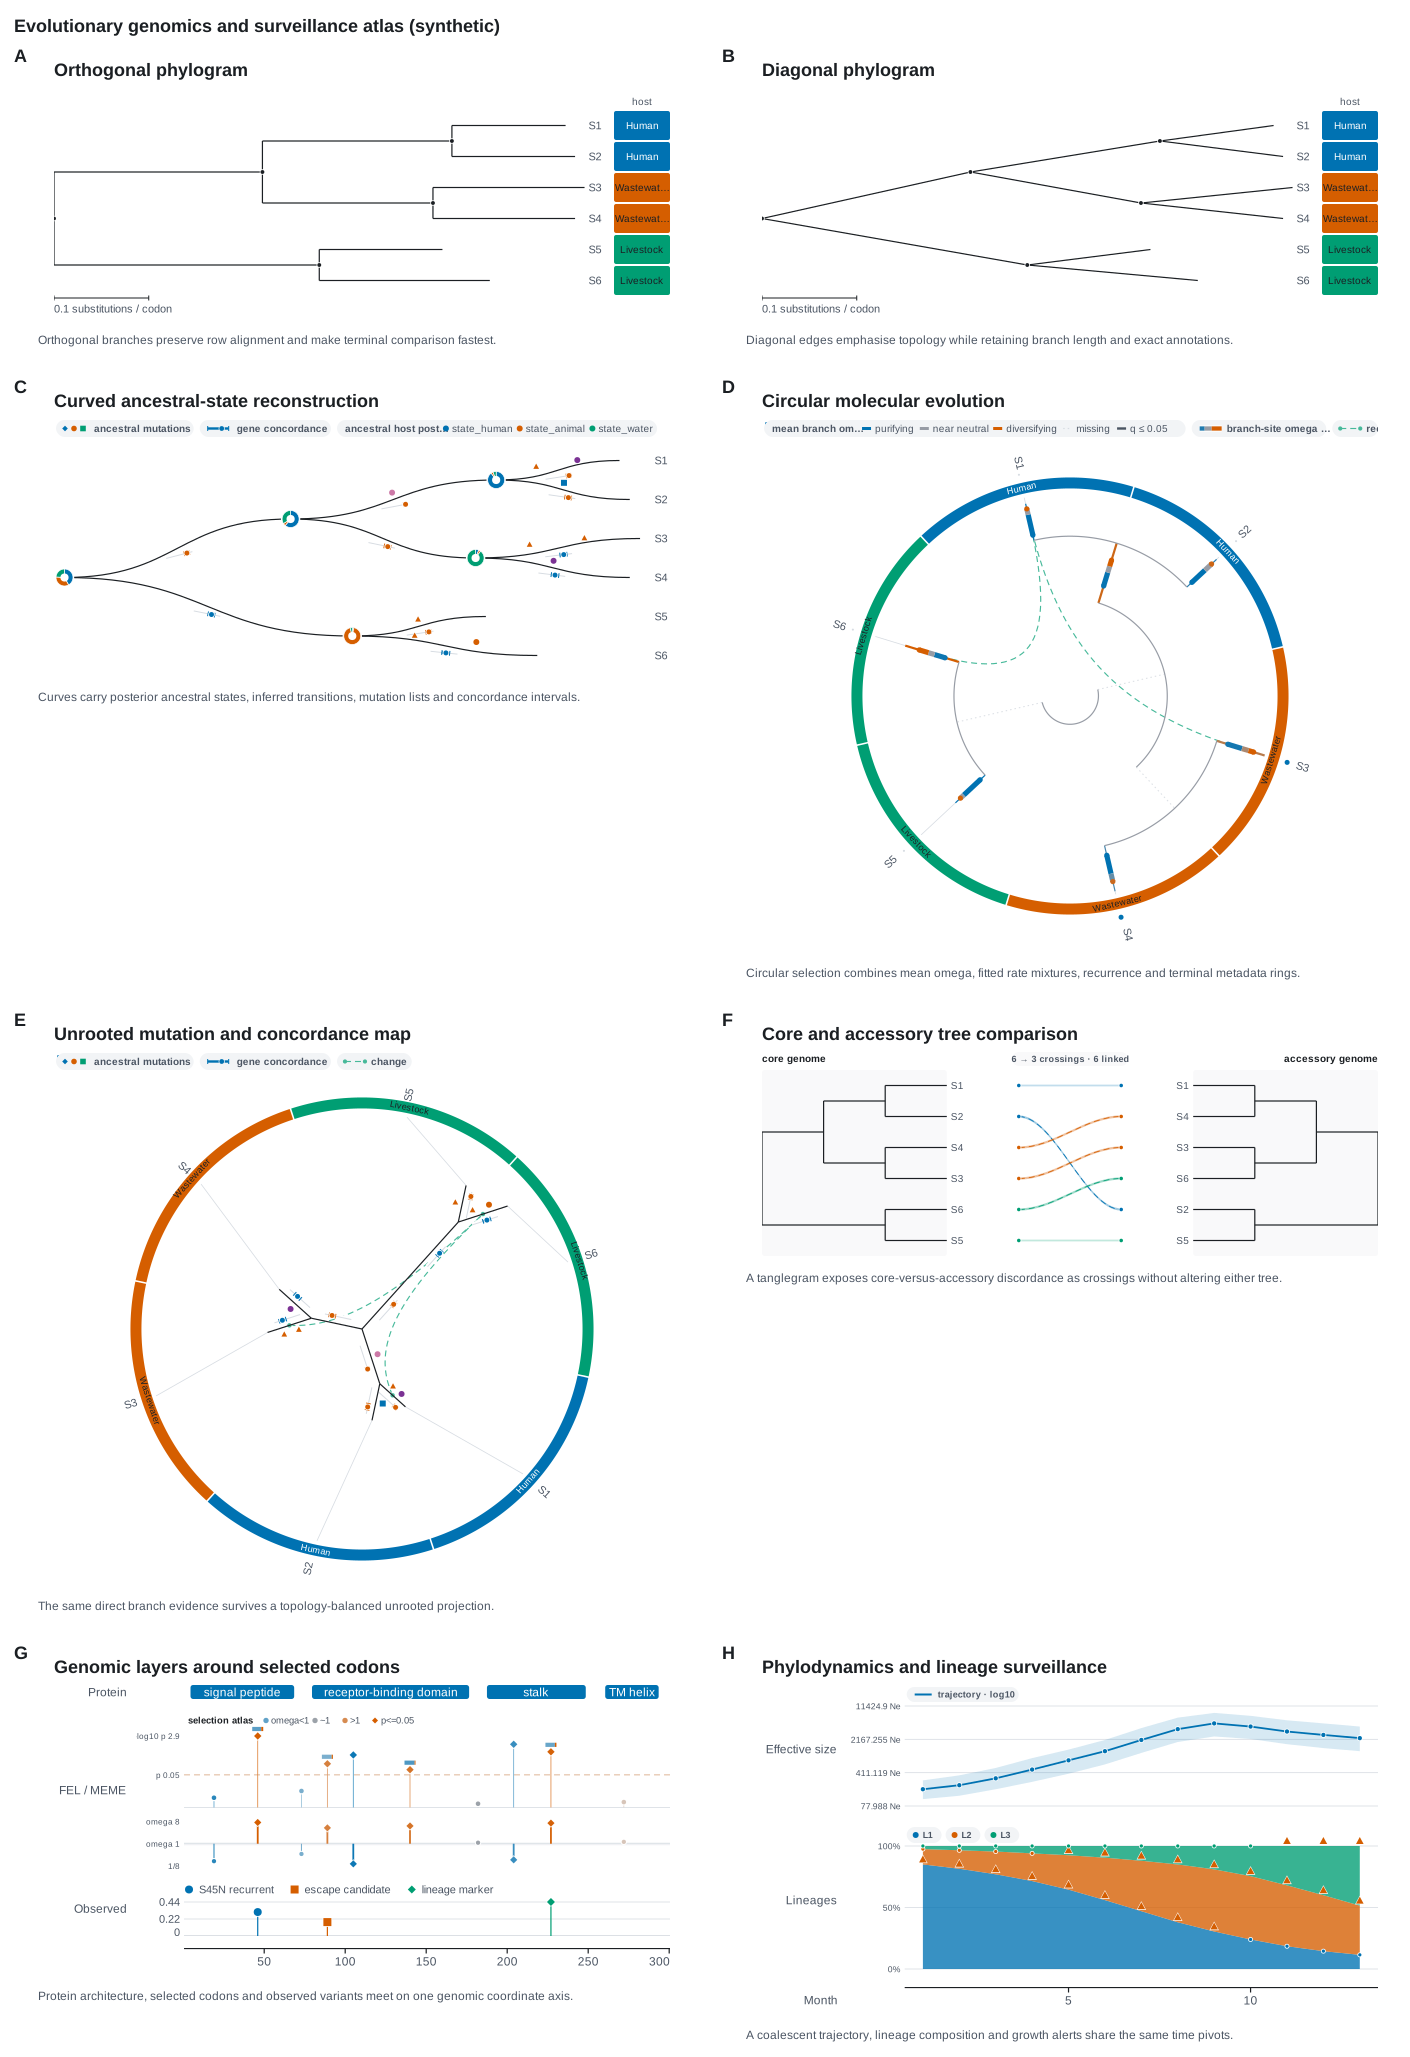
Ancestral states and branch events State probabilities as donuts on internal nodes, events on the branch that owns them, and a branch estimate with whiskers (panels C and E).
-
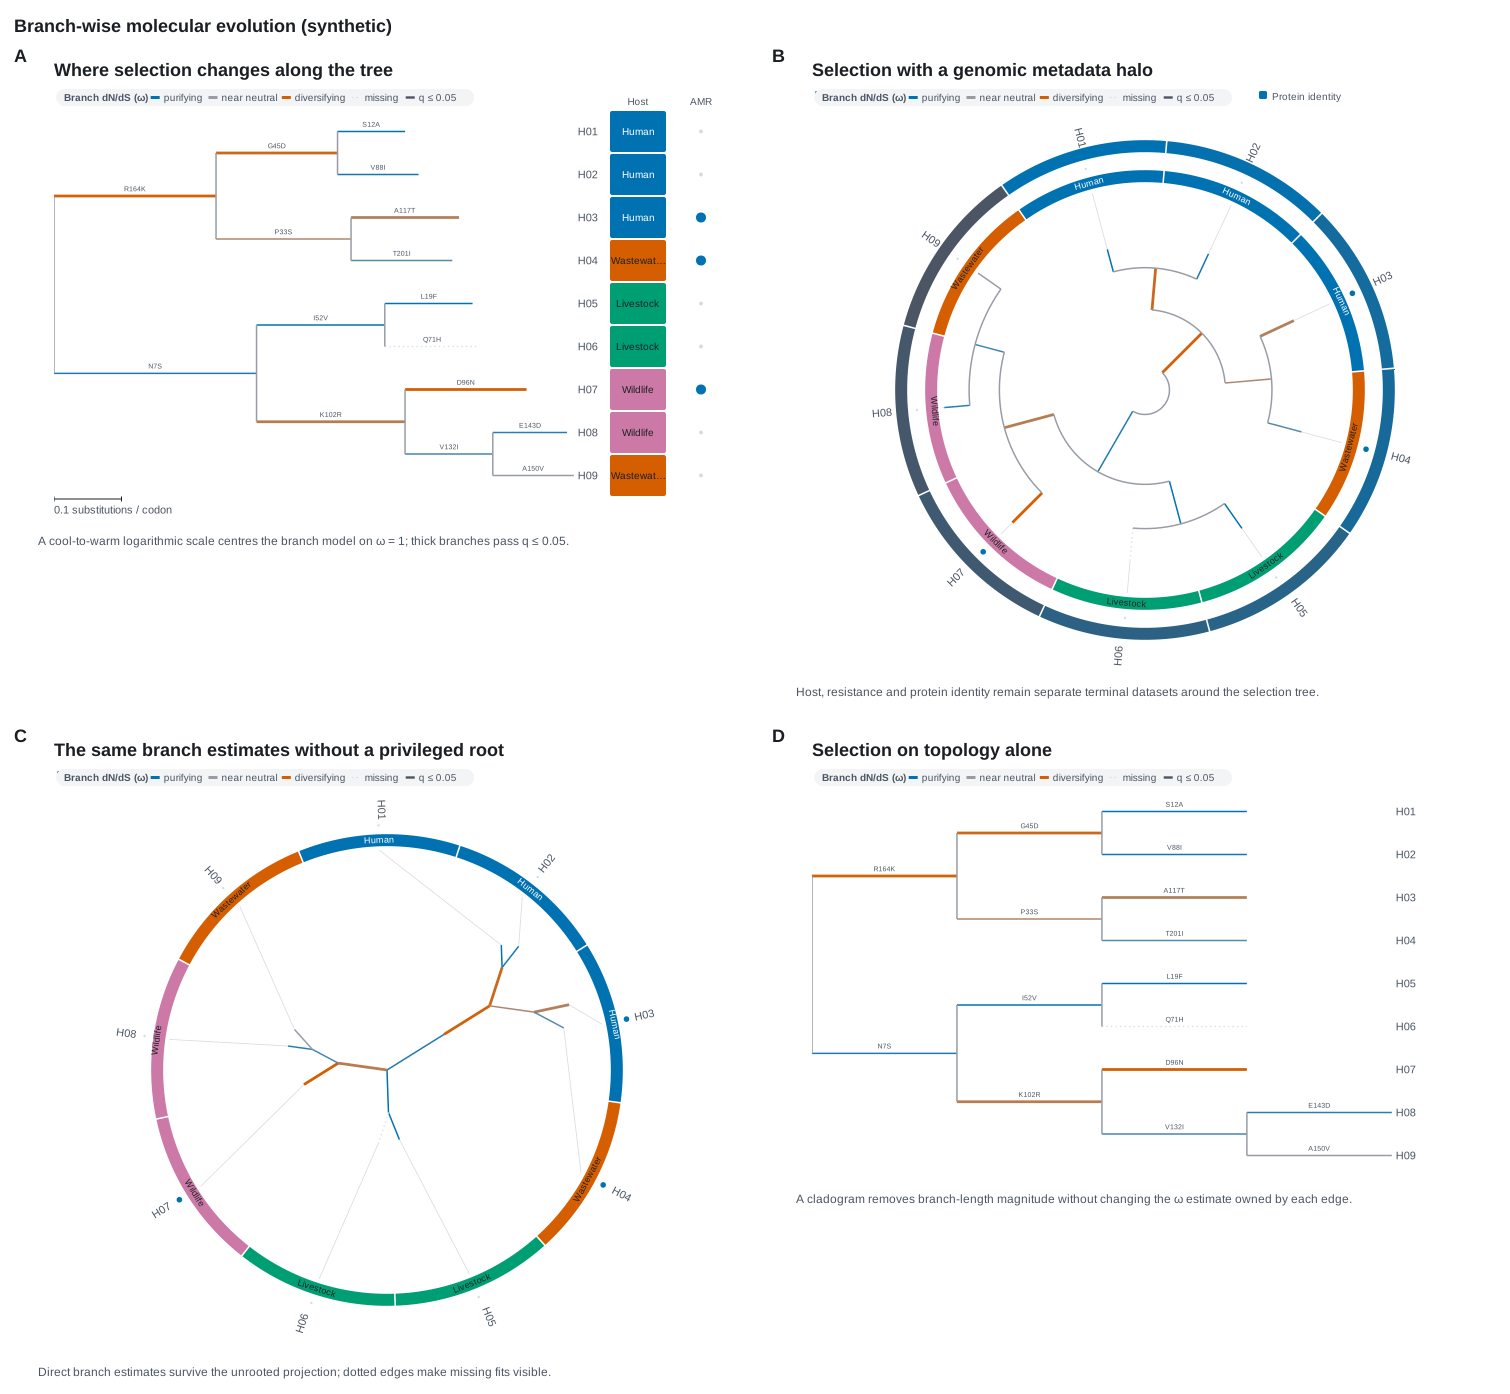
Selection on branches Branches coloured by ω, cool below one and warm above it, with the branches that pass a significance cut drawn heavier; fitted rate classes and recurrent changes can go on top.
-
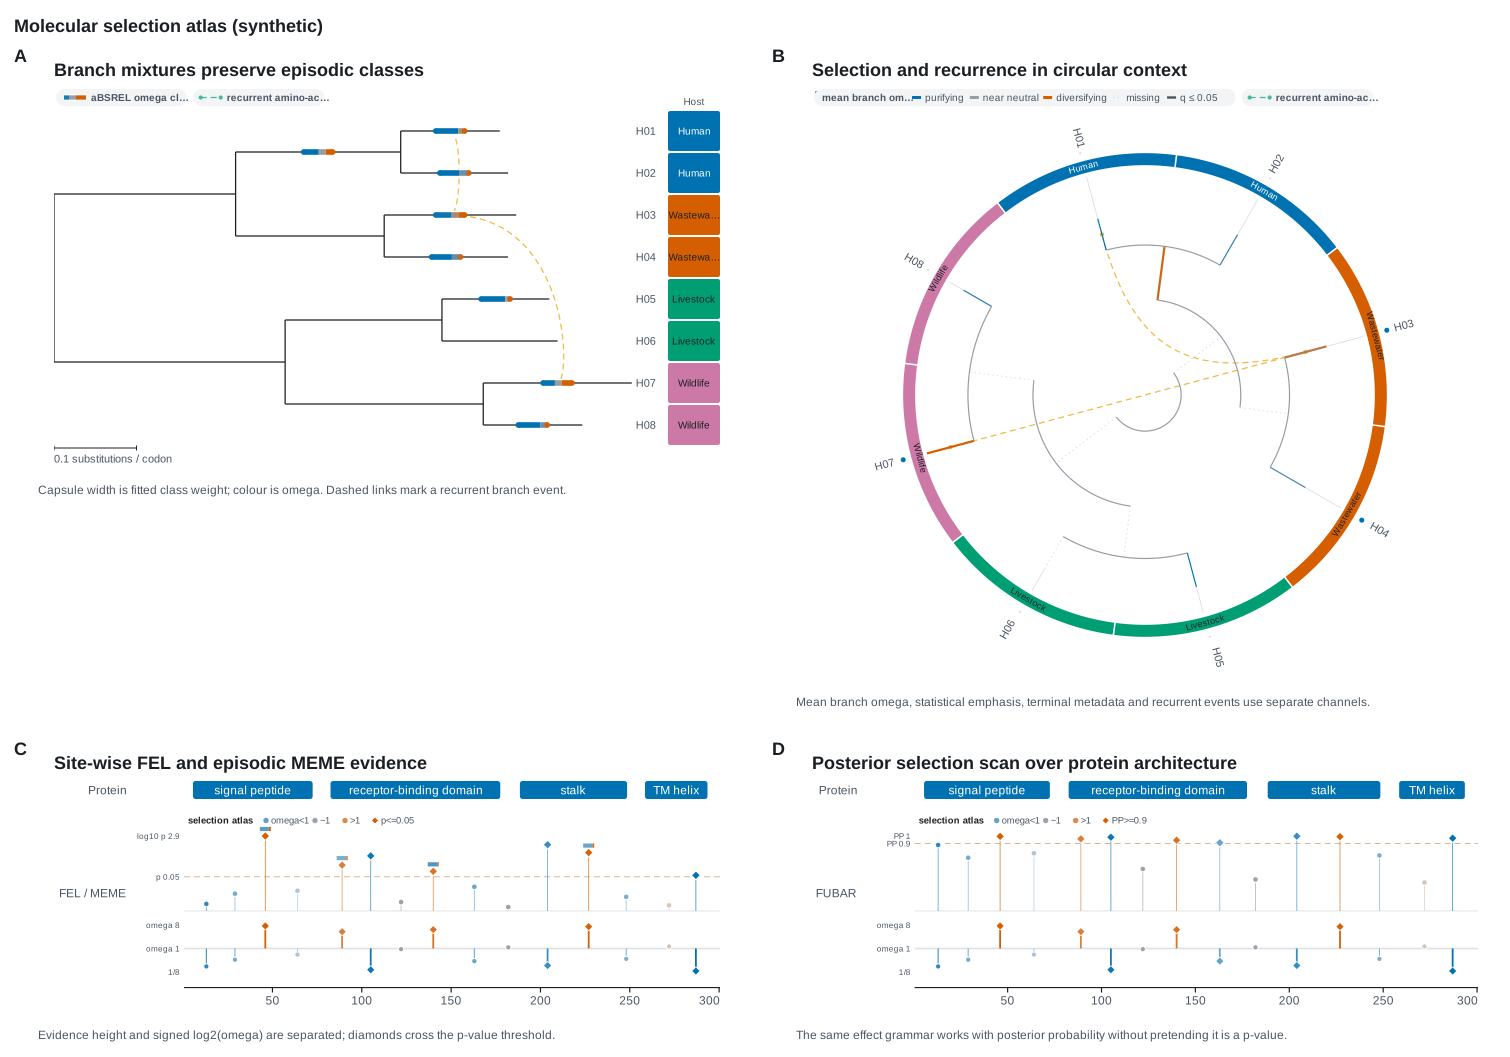
Site-wise selection Evidence, as a p-value or a posterior, in one tier and the signed log2(ω) effect in another, so a significant purifying site still reads as purifying.
-
Phylodynamic trajectory An estimate through time as a line with its interval as a ribbon, on a linear or log scale, with a reference such as R = 1 (panel H).
-
Lineage surveillance Lineage counts over their totals as stacked composition or as lines, with alerts for frequency and growth that never hide the counts (panel H).
From a clone of the repository, cargo run --example evolutionary_surveillance
writes the atlas to the current directory, so the code behind every panel is
there to read.
Related
-
Trees in every layout, two trees face to face, and spans painted onto clades.
-
Site-wise selection beside the variants, genes and codons it concerns.
-
Reading annotated trees, and the builders behind every layer on this page.
-
Complete programs that stack several tracks into one figure.