Gallery
Find the plot for the question you are asking of your data: start from what the data describes, or from the file you already have.
Every figure here is drawn by karyon in your browser, in this page's light or dark. On the pages they lead to, drag a figure along its genome, zoom it with the buttons under it or a pinch, and hover a mark for what it holds.
Browse by what you want to show
-
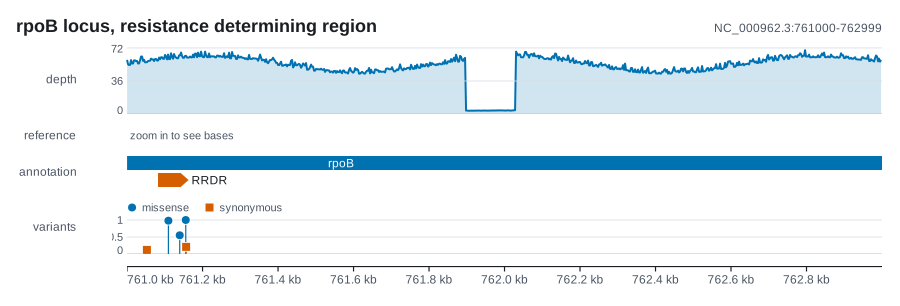
Signal and sequence A value or a symbol at every position: depth, windowed statistics, methylation by strand, the reference bases, logos and per-base attribution.
-
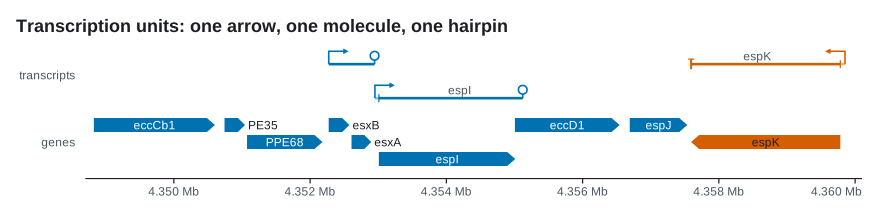
Annotation and coordinates Genes, transcription units and reading frames, with rulers in bases or codons and a key to the colours.
-
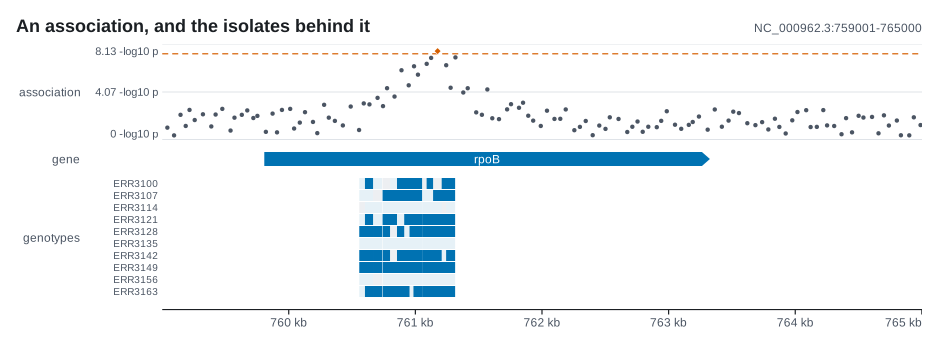
Variation and association From one call to a cohort: point and structural variants, copy number, variable sites, genotype matrices, association scans and site-wise selection.
-
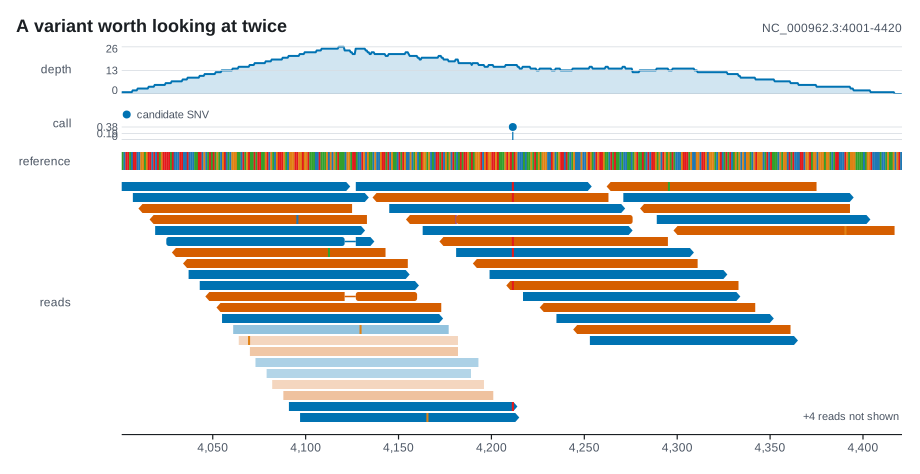
Reads and molecules The evidence one molecule at a time: pileups, split reads, per-read methylation, splice junctions and raw nanopore current.
-
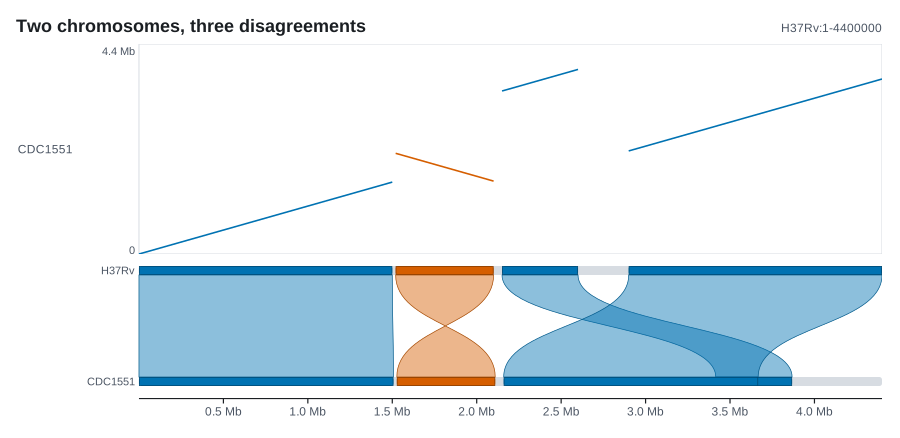
Comparisons and alignments Two or more sequences compared: alignments, domain architectures, dotplots, synteny ribbons and gene neighbourhoods.
-
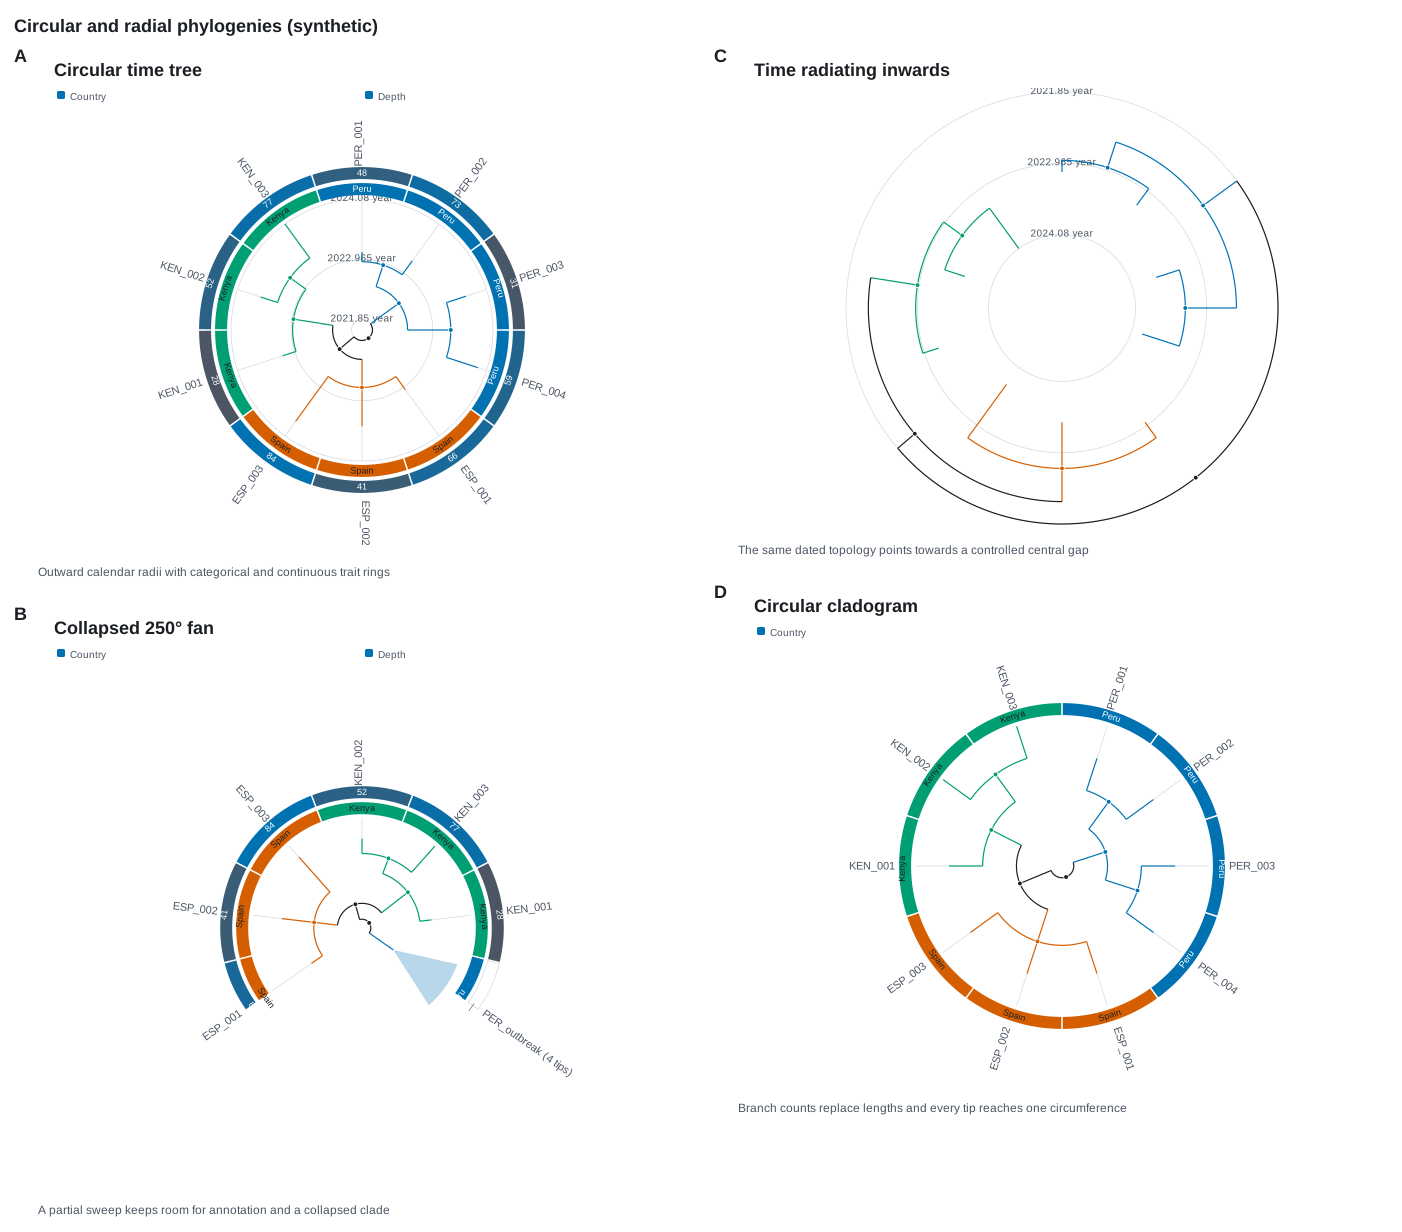
Phylogeny and clades Trees in every layout with their metadata, two trees face to face, spans painted onto clades, and a tree around a map.
-
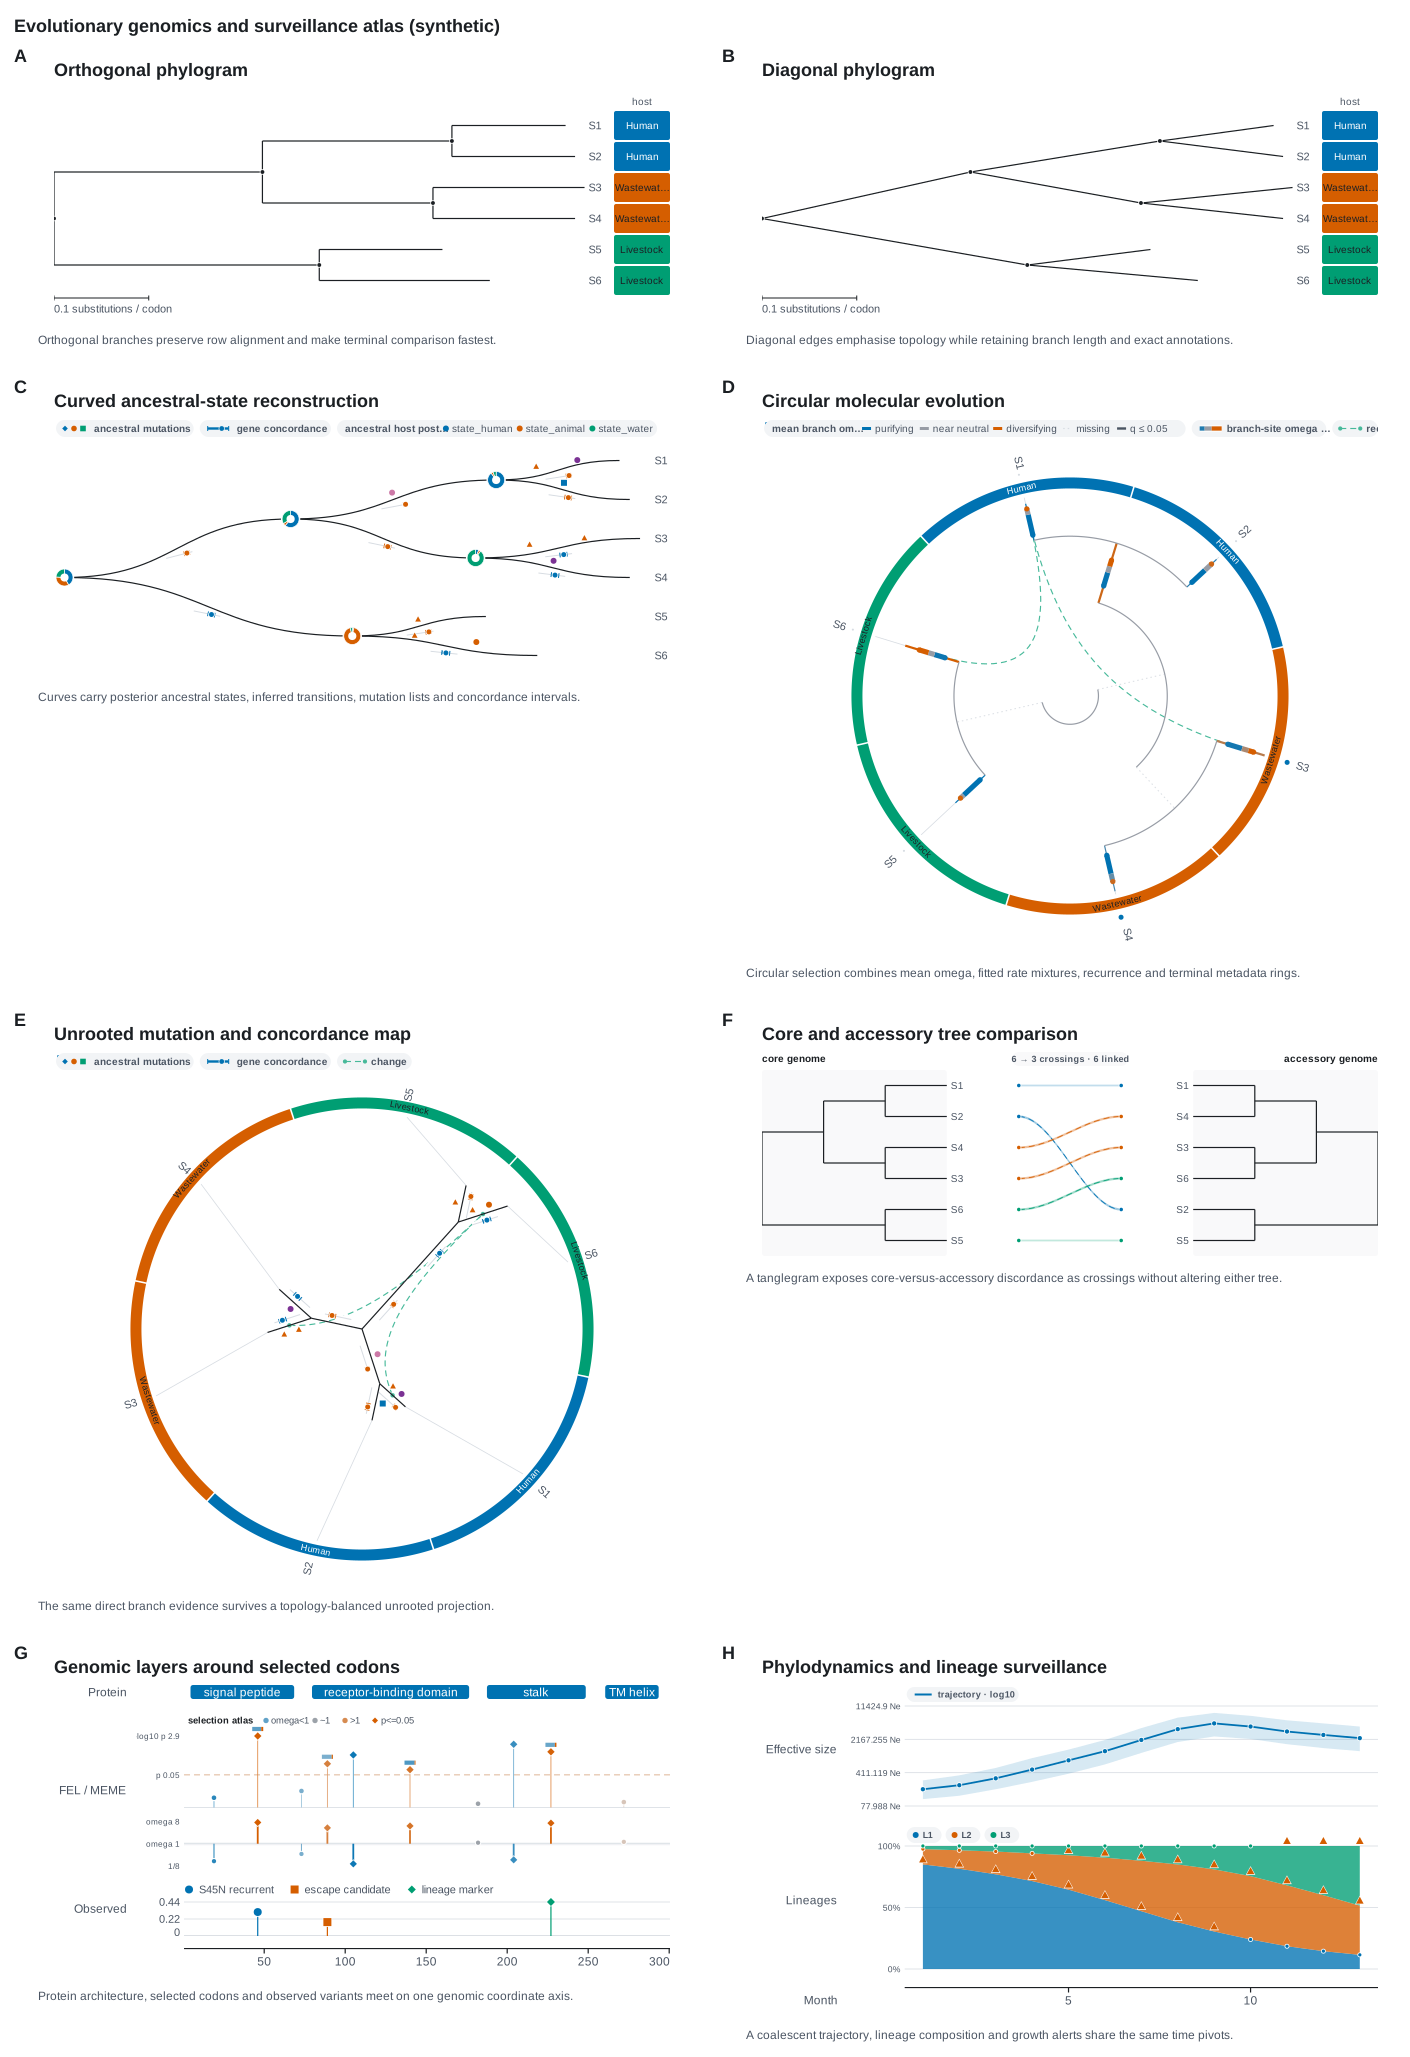
Evolution and surveillance Results fitted upstream: ancestral states, selection on branches and at sites, population trajectories and lineage counts through time.
-
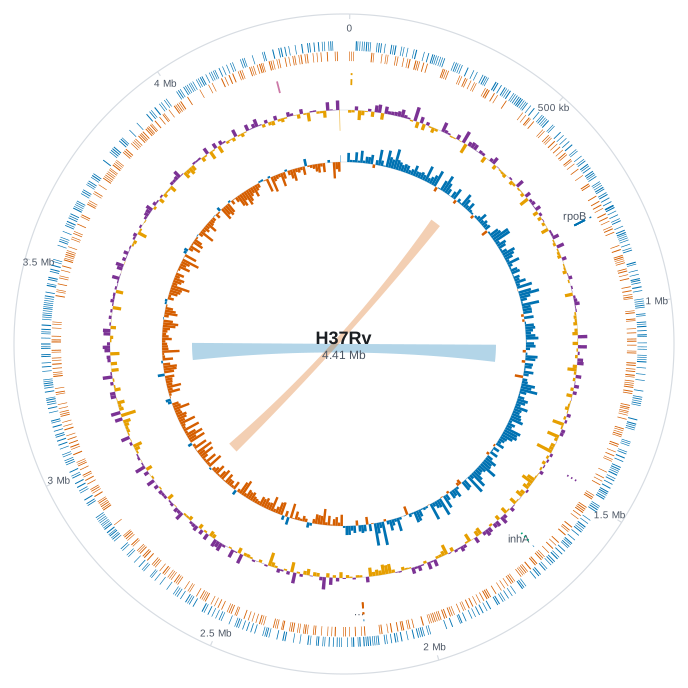
Whole genomes and maps Context beyond one locus: an ideogram, a whole assembly, a circular genome and a world map.
Choose from the shape of your data
Find the file you have: the plot links to its reference and names the command line flag that draws it, and the route opens its page in this gallery.
| Your data | Start with | Route |
|---|---|---|
Aligned reads: a BAM, or SAM text as samtools view writes it |
Read pileup, --pileup |
Reads and molecules |
Reads aligned in pieces: a BAM or SAM with SA tags |
Split reads, --split-reads |
Reads and molecules |
Splice junction counts: STAR's SJ.out.tab |
Splice junctions, --junctions |
Reads and molecules |
| Methylation calls read by read: a Bismark methylation extractor file | Methylation by molecule, --bisulfite |
Reads and molecules |
| Raw nanopore current and a basecaller move table | Nanopore signal | Reads and molecules |
A value per base: bedGraph, samtools depth, a column of values, or the depth of a BAM |
Coverage, --coverage |
Signal and sequence |
| A statistic in windows: bedGraph | Windowed statistic, --windows |
Signal and sequence |
Modified bases per strand: bedMethyl from modkit pileup |
Methylation by strand, --methylation |
Signal and sequence |
| Per-base model attribution: bedGraph, plus the reference as FASTA | Per-base attribution, --dynseq with --with-sequence |
Signal and sequence |
| Aligned sequences of a motif: aligned FASTA | Sequence logo, --logo |
Signal and sequence |
| A reference sequence: FASTA | Reference sequence, --sequence, or six reading frames, --orfs |
Signal and sequence, Annotation and coordinates |
| Genes and other intervals: BED, GFF3 or GTF | Features, --features |
Annotation and coordinates |
| Point calls: VCF | Point variants, --variants |
Variation and association |
Structural calls: VCF with symbolic alleles or SVTYPE |
Structural variants, --structural |
Variation and association |
Copy number segments: CNVkit .cns, ASCAT or .seg |
Copy number, --copy-number with --ploidy |
Variation and association |
| Closely related genomes: aligned FASTA | Variable sites, --snps, or a multiple alignment, --msa |
Variation and association, Comparisons and alignments |
| The genotypes of a cohort: VCF with samples | Genotypes by sample, --genotypes |
Variation and association |
| A value per sample per site: a table | Genotype matrix, --matrix |
Variation and association |
| Association statistics: a table of position and value | Association scan, --manhattan |
Variation and association |
| Site-wise results from a codon model | Site-wise selection | Variation and association, Evolution and surveillance |
A pairwise alignment: PAF from minimap2 |
Dotplot, --dotplot, or synteny ribbons, --synteny |
Comparisons and alignments |
| Protein domains: an InterProScan table | Domain architectures, --domains |
Comparisons and alignments |
| Genes from several genomes, and the hits between them | Gene neighbourhoods, --loci with --links |
Comparisons and alignments |
| A phylogeny: Newick, with or without BEAST and NHX annotations | Annotated tree, --tree |
Phylogeny and clades |
| Two trees over the same taxa | Tanglegram, --tanglegram with --against |
Phylogeny and clades |
| Spans carried by named taxa: Gubbins GFF3, and the tree | Clade blocks, --clades with --with-tree |
Phylogeny and clades |
| Ancestral states, branch events or branch ω, as tree annotations | Ancestral states and branch events, Rust only | Evolution and surveillance |
| Estimates through time, such as effective population size or R | Phylodynamic trajectory | Evolution and surveillance |
| Lineage counts and totals through time | Lineage surveillance | Evolution and surveillance |
| Cytogenetic bands: a UCSC cytoBand table | Ideogram, --ideogram |
Whole genomes and maps |
| An assembly of many contigs or chromosomes | Whole assembly, Rust only | Whole genomes and maps |
| A circular chromosome or plasmid | Circular genome, --circular |
Whole genomes and maps |
| A latitude and longitude per sample | Map, Rust only | Whole genomes and maps |
BAM, BCF, compressed files and CRAM
A BAM file, a BCF and anything compressed with gzip or bgzip (.vcf.gz,
.gff3.gz) are read as they are. CRAM comes in through a pipe:
samtools view writes the text these readers take, and a track file can
be - for standard input. See
compressed and binary files.
Tracks and drawings
Most plots here are tracks: bands that stack over one shared coordinate
axis, so any of them can sit above or below any other. The circular
genome, the map and the tree around a map are drawings instead (Rings,
Map and PhyloMap), each with a coordinate system of its own, and a
Panels sheet puts drawings and figures side by side.
Every track in one place
-
All 38 track types, family by family, with the options of each and the files it reads.
-
Complete programs that stack several of these plots into one figure.
-
Every flag, and how the order of the flags becomes the order of the stack.
Every figure in this gallery is drawn by a program in the repository's
examples/ directory, so the code behind each one is there to read and copy.