Evolution and surveillance tracks
Draw what changed through time: an estimated trajectory with its uncertainty, and observed lineage counts or frequencies with alerts, on one time axis.
The Rust snippets use ?, so they belong in a function that returns Result<(), Box<dyn std::error::Error>>. To choose a track by its picture, start from the gallery.
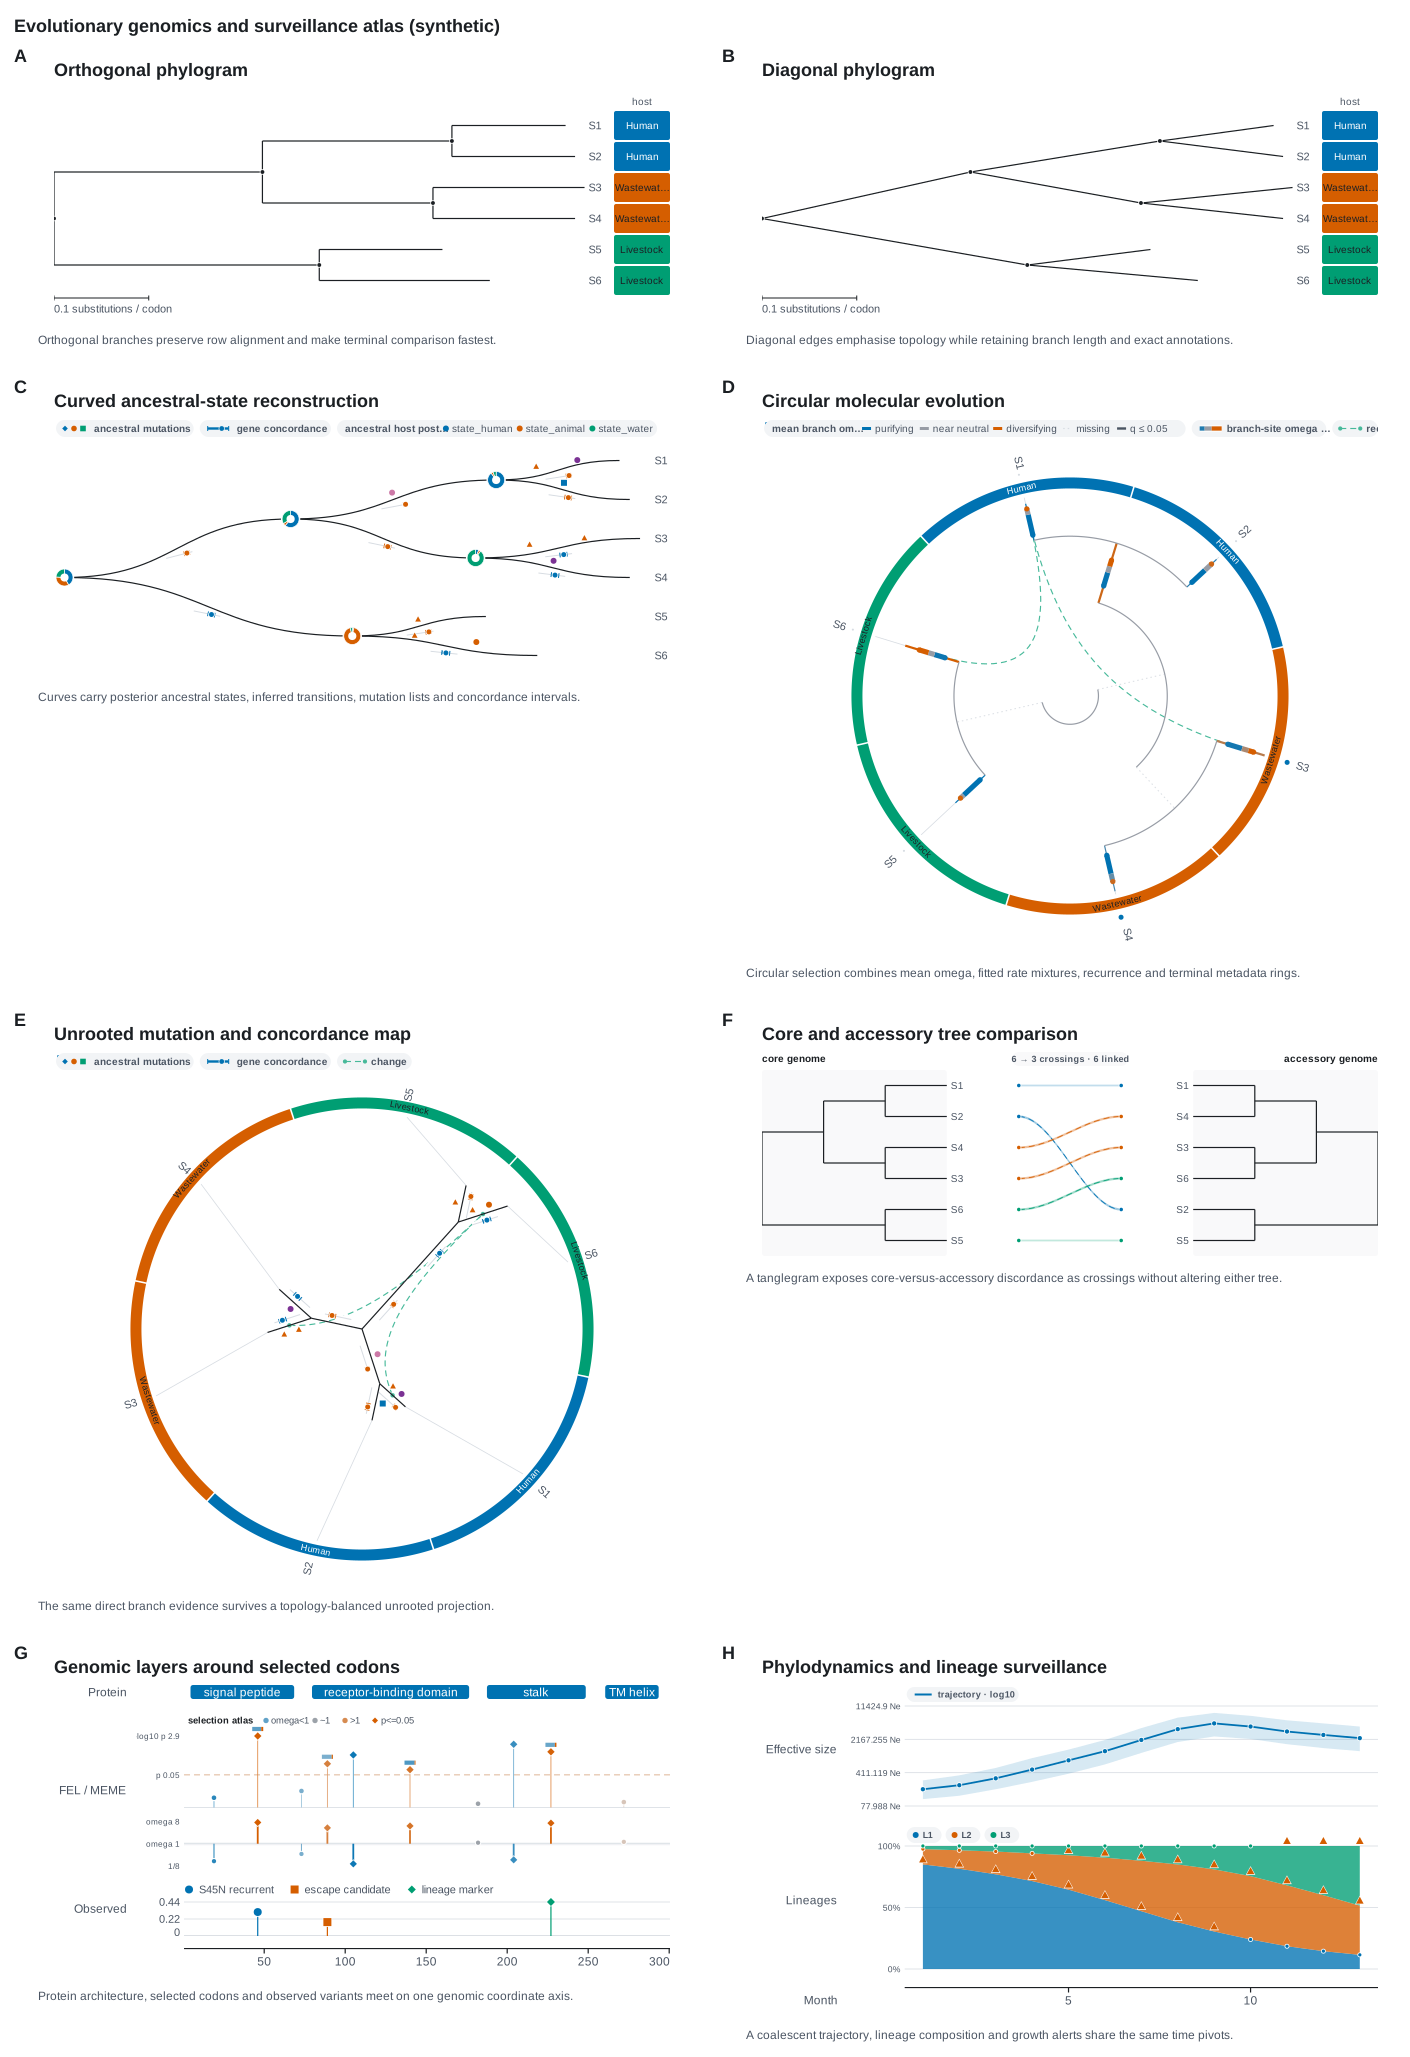
Both tracks put time on the figure's shared integer axis, so an inferred trajectory, the observed lineage composition and a ruler share exact time points without pretending to be the same kind of evidence. A time point is an integer: months since sampling began, days since an epoch, or any other whole unit, used consistently across the figure.
Count time from nought and name the unit
A time point sits in the middle of its unit, and the ruler prints positions 1-based, as it does for bases: point 0 is labelled 1. Store week 1 as 0 and year 2015 as 2014, and ask for a ruler that counts whole units, which writes a year as 2015 rather than 2,015 and names its unit: with plot() that is .add_axis().label("month").adjust(|axis| axis.counting()). The tooltips count the same way. A time with fractions, as a skyline in decimal years, is a continuous one: store it in thousandths, year 2015.25 as 2015250, and tell the ruler and the track, axis.counting().decimals(3) and .time_decimals(3), which then write it as 2015.25. The command line does all of this from a table's own times.
PhylodynamicTrack
A time-varying estimate with an optional uncertainty interval: an effective population size skyline, a reproductive number, a lineage growth rate, fitted upstream. The estimate is a line and the interval a quiet ribbon.
| Rust | .add_phylodynamics(points) on plot(); PhylodynamicTrack::new(points) |
| Command line | --phylodynamics FILE, with --log, --threshold, --color, --height |
| Reads | a table of a time, an estimate and, where there is one, its interval, its columns found by their headers: week or year, mean or median, lower and upper (read::series::estimates) |
use karyon::{PhylodynamicPoint, PhylodynamicScale, Plot, Region};

Plot::over(Region::new("month", 0, 4)?)
    .remove_region_label()
    .add_phylodynamics(vec![
        PhylodynamicPoint::new(0, 120.0).interval(70.0, 210.0),
        PhylodynamicPoint::new(1, 430.0).interval(250.0, 760.0),
        PhylodynamicPoint::new(2, 260.0).interval(150.0, 480.0),
        PhylodynamicPoint::new(3, 300.0),
    ])
    .label("effective population size")
    .adjust(|track| track.unit("Ne").scale(PhylodynamicScale::Log10))
    .add_axis()
    .label("month")
    .adjust(|axis| axis.counting())
    .save("skyline.svg")?;
Options
| Method | What it does | Default |
|---|---|---|
.label("effective population size") |
Names the track in the left gutter | none |
.height(160.0) |
Band height in pixels | 126 |
.scale(PhylodynamicScale::Log10) |
Linear or base-ten Log10 |
Linear |
.unit("Ne") |
Unit shown in the tooltips and on the axis | none |
.color("#0072b2") |
Colour of the estimate | theme accent |
.reference(1.0, "R = 1") |
Adds an independent guide line, such as R = 1 |
none |
.show_points(false) |
Shows or hides the point markers; the tooltips stay | shown |
.show_interval(false) |
Shows or hides the uncertainty ribbon | shown |
.time_decimals(3) |
Writes each time in the tooltips as a continuous time kept to that many places, as a ruler told .decimals(3) writes it |
0, whole units counted from one |
Notes
The track renders an inference someone else made. It does not fit a clock, a skyline, a coalescent or a birth-death model, and it draws the points in time order whatever order they arrive in.
A time is a coordinate, as a base is, and counts from nought: time 0 is the first, which a ruler made with AxisTrack::counting and the tooltips both call 1. The command line reads a table's times as they are written, so week 1 is week 1 on the ruler and on hover.
Log mode leaves out an estimate of nought or below rather than inventing a small positive value to draw. PhylodynamicPoint::interval(lower, upper) keeps only finite bounds in order, so a reversed, missing or non-finite interval draws no ribbon, while every accepted estimate and bound stays exact in its tooltip.
SurveillanceTrack
Observed lineage, clade, genotype or mutation counts through time, as stacked composition or as one line per lineage, with alerts for a high frequency or a fast rise.
| Rust | .add_surveillance(observations) on plot(); SurveillanceTrack::new(observations) |
| Command line | --frequencies FILE, with --style stacked or --style line, --threshold for the frequency alert, --growth, --min-total, --counts, --height |
| Reads | a table of a time, a group, a count and a total, its columns found by their headers: week, lineage or mutation, count, total (read::series::counts) |
use karyon::{Plot, Region, SurveillanceMetric, SurveillanceObservation, SurveillanceStyle};

Plot::over(Region::new("month", 0, 2)?)
    .remove_region_label()
    .add_surveillance(vec![
        SurveillanceObservation::new(0, "L1", 34, 100),
        SurveillanceObservation::new(0, "L2", 66, 100),
        SurveillanceObservation::new(1, "L1", 72, 120),
        SurveillanceObservation::new(1, "L2", 48, 120),
    ])
    .label("lineage frequency")
    .adjust(|track| {
        track
            .metric(SurveillanceMetric::Frequency)
            .style(SurveillanceStyle::Stacked)
            .minimum_total(20)
            .frequency_alert(0.50)
            .growth_alert(0.15)
    })
    .add_axis()
    .label("month")
    .adjust(|axis| axis.counting())
    .save("surveillance.svg")?;
Options
| Method | What it does | Default |
|---|---|---|
.label("lineage frequency") |
Names the track in the left gutter | none |
.height(160.0) |
Band height in pixels | 138 |
.metric(SurveillanceMetric::Count) |
Frequency, each count over its total, or the raw Count |
Frequency |
.style(SurveillanceStyle::Lines) |
Stacked composition, or one line per lineage with Lines |
Stacked |
.minimum_total(20) |
Leaves out observations whose total is below this sampling floor, and breaks the line at a time it empties | 1 |
.frequency_alert(0.50) |
Flags observations at or above this frequency | none |
.growth_alert(0.15) |
Flags a rise of at least this much frequency from one observed step to the next | none |
.show_points(false) |
Shows or hides the observation markers | shown |
.time_decimals(3) |
Writes each time in the tooltips as a continuous time kept to that many places, as a ruler told .decimals(3) writes it |
0, whole units counted from one |
Notes
A time counts from nought, as a base does, and a ruler made with AxisTrack::counting and the tooltips both call time 0 the first, 1. The command line reads a table's times as they are written.
Frequency divides each count by the total supplied with it, and minimum_total is a visible sampling floor rather than a pseudocount: a time whose every row is under it is a gap, where the line breaks and the stack is left open, rather than a time the line runs across. An alert is a small symbol with its exact reason in the tooltip; it never replaces the count and the total.
An alert is a triangle in its lineage's colour, and a chip after the lineages' own says what the triangles flag, as ≥ 50% or up 15 points. A rise is in points of frequency, so growth_alert(0.15) flags a lineage going from 20% to 35%, not one going from 20% to 23%. On the command line --threshold sets the frequency alert and --growth the rise, --min-total the floor and --counts the metric.
Absence has to be stated. Supply an explicit count of nought where a lineage was looked for and not found, because a missing lineage and time pair is never turned into a nought. A stacked view leaves out a time whose composition is incomplete, a line view breaks at the gap, and two observations of one lineage at one time are neither summed nor joined: each of those gets a small grey mark whose tooltip gives the reason.
A count above its total is not a frequency, so under Frequency it is not drawn, and undrawable_observation_count() says how many were left out. The track does no smoothing, interpolation, forecasting or anomaly testing.