What do you have?
Pick your data. Each page has one command, the figure it draws, and the few changes people make most. The figure is that command run in your browser over the example files, so you can zoom into it, and move it along the genome where it is drawn over one.
-
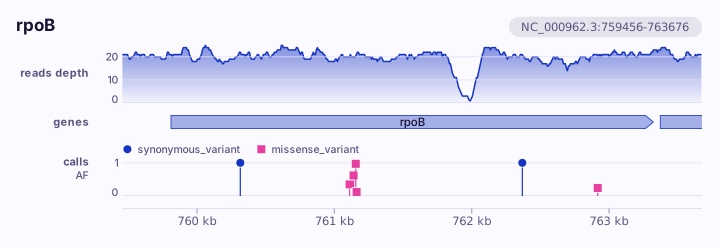
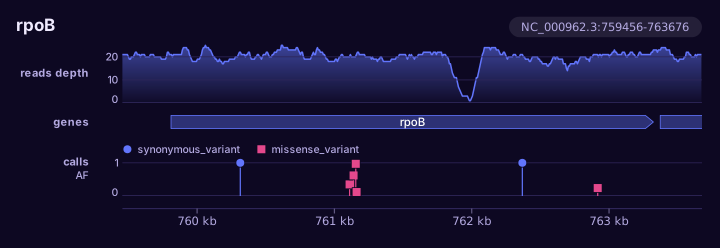
Reads, calls and genes A BAM, a VCF and an annotation over one place.
-
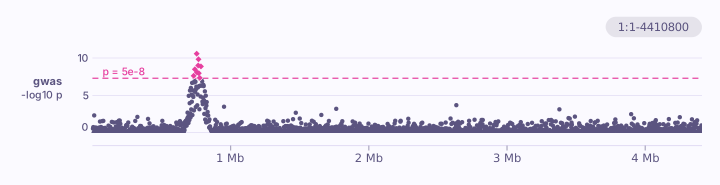
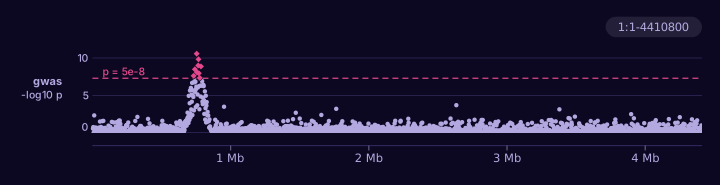
An association scan A table from PLINK, REGENIE, SAIGE or another association tool.
-
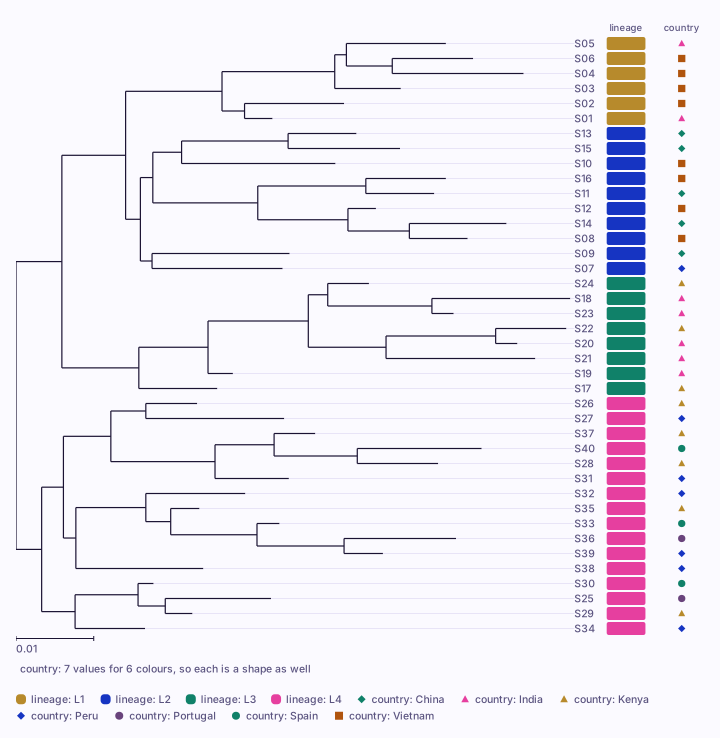
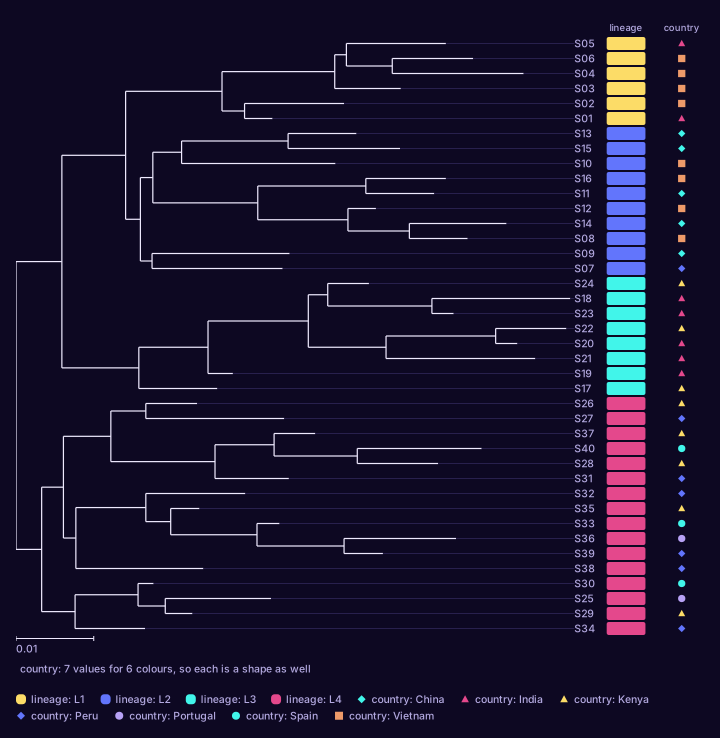
A tree and its samples A Newick tree and a sheet of what you know about each sample.
-
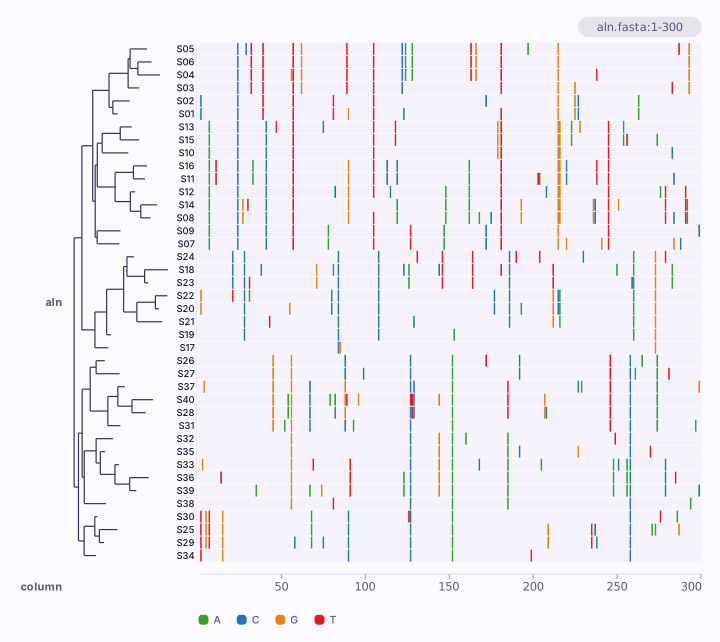
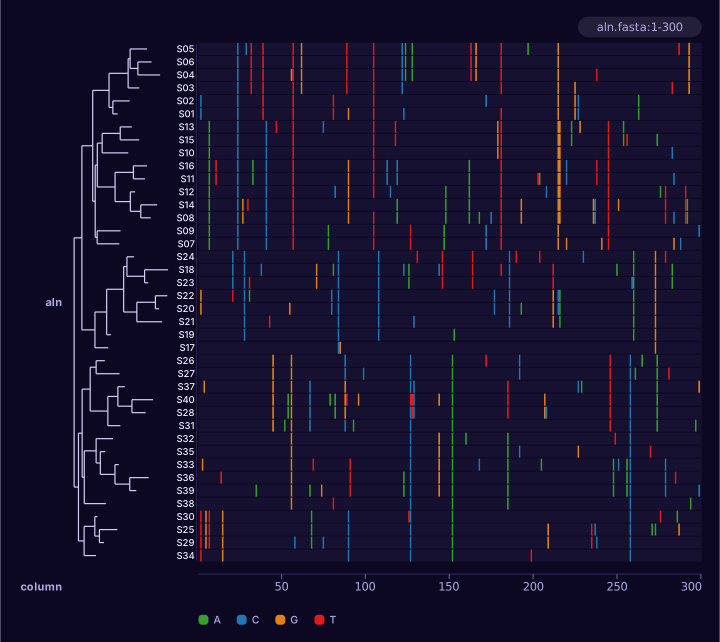
An alignment and its tree An aligned FASTA, in the order of a tree drawn beside it.
-
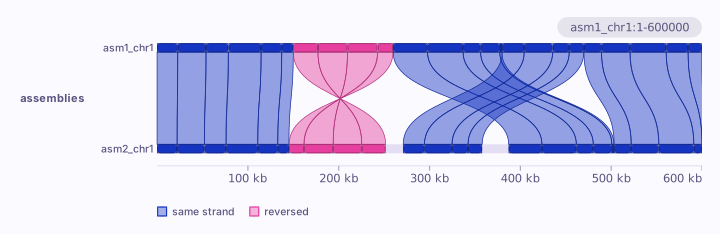
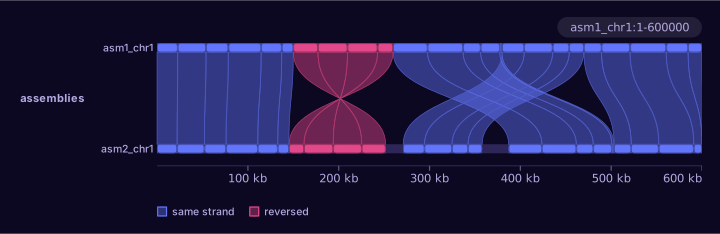
Two assemblies How two assemblies line up, from a PAF alignment.
-
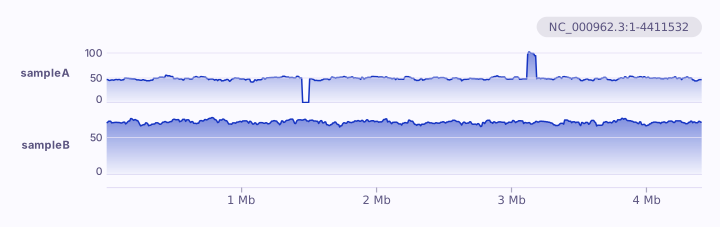
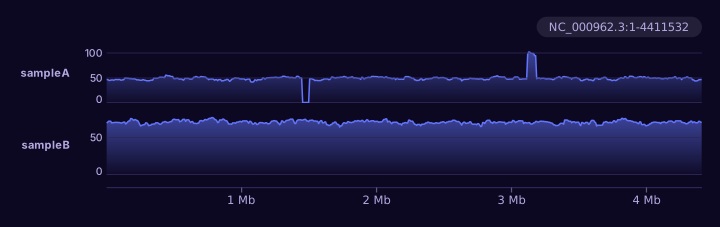
A whole sequence The depth of one sample or several along a whole chromosome.
-
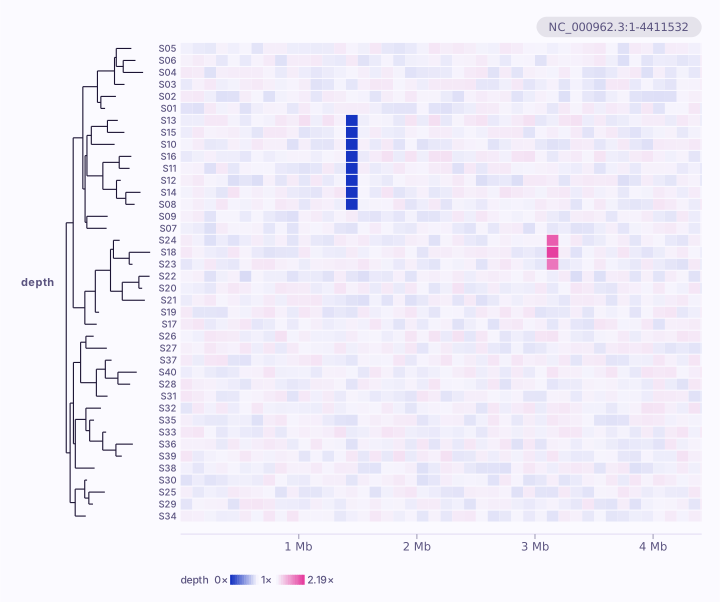
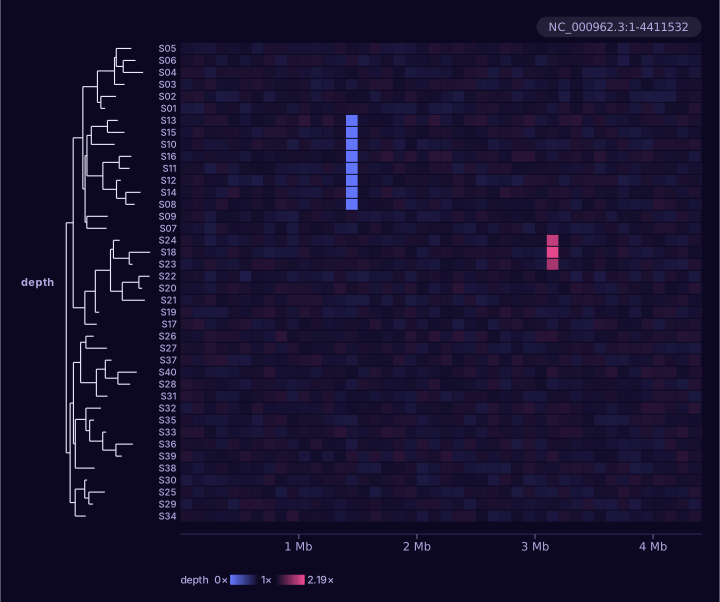
Many samples in windows The depth or copy number of many samples, in the order of a tree.
-
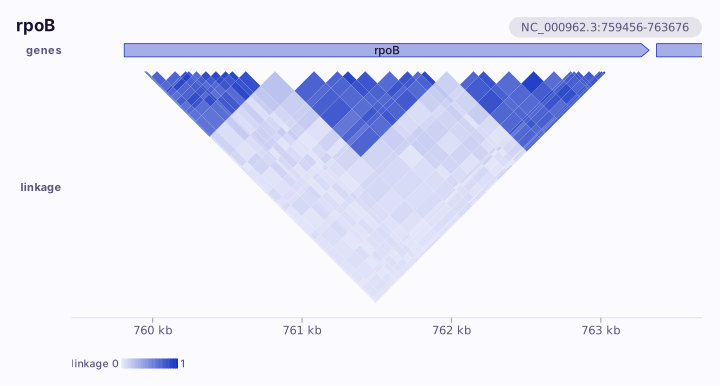
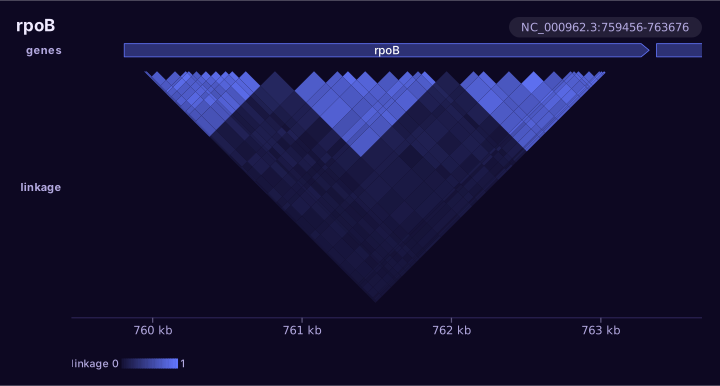
Pairs of positions Linkage from PLINK, contacts from a Hi-C map, scores between sites.
-
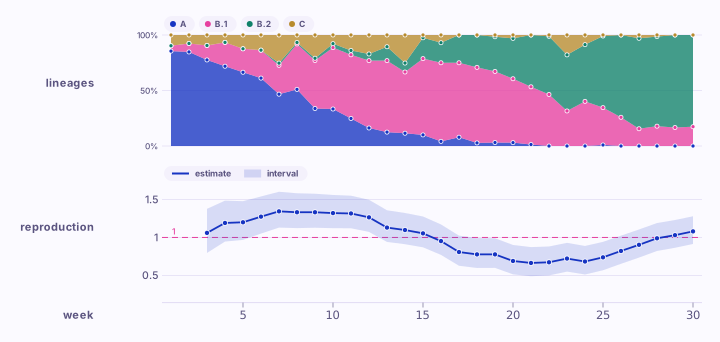
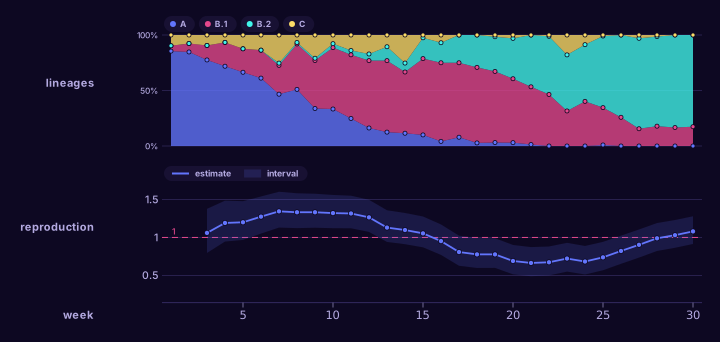
Counts over time Lineages or mutations over time, and an estimate beside them.
-
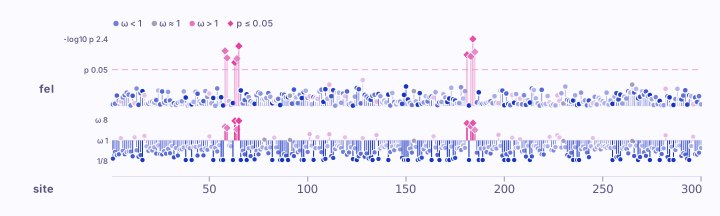
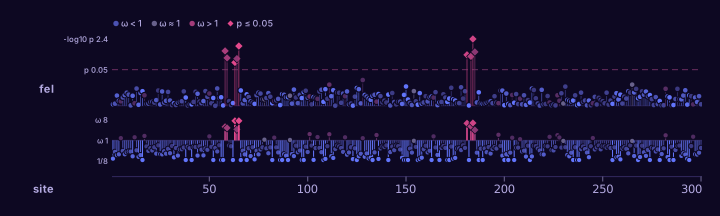
Selection along a gene A test at each site, from HyPhy or a table of your own.
-
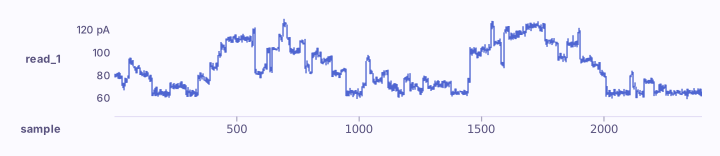
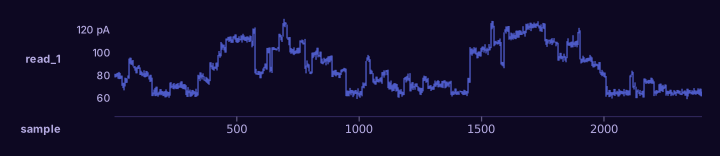
A nanopore signal The raw current of a read, from a SLOW5 file.
Something else? The gallery shows every kind of figure karyon draws, and the command line reference every file it reads.