Scale and key tracks
Give a figure what it is read by: a coordinate ruler, a ruler in codons that names residues, and a key to the colours that takes a band of its own.
The Rust snippets use ?, so they belong in a function that returns Result<(), Box<dyn std::error::Error>>, and names such as depth stand for data you already hold.
AxisTrack
The coordinate ruler: ticks on round 1-based coordinates, the numbers a reader would type into a genome browser, in one unit for the whole ruler. plot() puts one under the tracks without being asked.
| Rust | .add_axis() on plot(), which puts the ruler where the call sits instead of under the tracks; AxisTrack::new() |
| Command line | --axis, with --label, --height; --no-axis leaves the ruler out |
| Reads | nothing |
Options
| Method | What it does | Default |
|---|---|---|
.label("position") |
Names the ruler in the left gutter (--label) |
none |
.height(30.0) |
Band height in pixels (--height) |
26 |
.tick_spacing(80.0) |
Target distance between ticks, in pixels | 110 |
.center_on_bases(true) |
Puts each tick in the middle of its base rather than on its left edge | off |
.counting() |
A ruler of whole units that are not bases, weeks, sites, samples or columns: ticks in the middle of each unit and plain numbers, 2015 rather than 2,015 and 1500 rather than 1.5 kb |
off |
.decimals(3) |
With counting, a continuous quantity kept to that many places: coordinate 2,015,250 is written 2015.25, counted from nought, and the ticks fall where the value is round |
0, whole units counted from one |
Notes
Coordinates are 0-based everywhere in the crate except where a reader looks, and the ruler is one of those places: a tick reading 761,100 is the coordinate that goes into a browser's search box or a samtools region string, the same 1-based form Region::parse reads (see Coordinates). tick_spacing asks for a density, not a step; the step is rounded to 1, 2 or 5 times a power of ten so the labels stay round. One unit, bp, kb or Mb, is chosen from the largest label and the step together and used for the whole ruler, since a ruler that changes unit half way across has to be decoded rather than read.
A ruler marks boundaries, which is right while a base is a fraction of a pixel. Once a base is a column you can see, as in a logo, a short motif or a figure of time points, center_on_bases puts each number under the column it counts. counting does that too and writes plain numbers, for an axis whose unit is not a base: the command line uses it under an alignment, a table over time, the sites of a gene and a read's samples, and names the unit in the margin.
plot() puts a ruler under the last track laid on the coordinates, so a figure of trees alone gets none, and a tree or a panel of sites stacked under a coverage profile sits below the ruler rather than above it. .add_axis() puts it where the call sits and is not doubled, .remove_axis() leaves it out, and calling .add_axis() twice gives a tall figure a ruler at the top and at the bottom. An AxisTrack passed to add_track is drawn as well as the automatic one, which makes two. On the command line --axis does the same as add_axis, and --no-axis the same as remove_axis.
CodonTrack
A ruler in codons, so a coding sequence can be read in protein coordinates: codons numbered, translated where there is room for a letter, and counted from the far end on the reverse strand.

| Rust | .add_codons(start, end, strand) on plot(); CodonTrack::new(start, end, strand) |
| Command line | none: library only |
| Reads | nothing from a file; takes the coding span, and the bases through sequence |
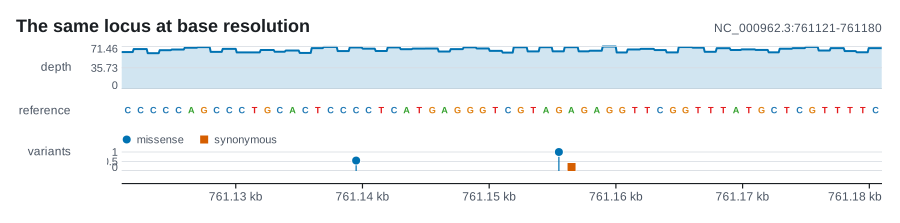
use karyon::{plot, CodonTrack, Strand, Variant};

// chromosome: Vec<u8>, the whole sequence from position 0
let rpob = CodonTrack::new(759_806, 763_325, Strand::Forward).sequence(0, chromosome);
assert_eq!(rpob.codon_of(761_154), Some(450));
assert_eq!(rpob.span_of(450), Some((761_153, 761_156)));

plot("NC_000962.3:761,121-761,200")?
    .add_variants(vec![Variant::new(761_154).value(1.0).category("S450L")])
    .label("variants")
    .add_track(rpob.label("rpoB"))
    .save("codons.svg")?;
Options
| Method | What it does | Default |
|---|---|---|
.sequence(0, bases) |
Attaches the reference bases from a 0-based start, so codons can be translated | none: numbers only |
.genetic_code(&table) |
Translates with another genetic code: its 64 residues in NCBI order, as a [u8; 64] |
NCBI table 1 |
.label("rpoB") |
Names the track in the left gutter | none |
.cell_height(16.0) |
Height of the codon cells, in pixels | 13 |
.color("#0072b2") |
Overrides the colour | the strand colour |
.numbering(10) |
Numbers every this many codons, instead of a spacing chosen for the zoom | automatic |
.show_start(false) |
Shows or hides the chevron on the first codon that says where the count starts | shown |
Notes
A variant in a coding sequence is named by residue: BRAF V600E, TP53 R175H, rpoB S450L. A figure drawn in bases cannot be pointed at with any of those names, and this sibling of AxisTrack can. The partition is itself the claim: two changes at different bases of one codon are competing alleles at one residue rather than a double mutant, and two changes in neighbouring codons are two substitutions however few bases apart they are.
On the reverse strand codon 1 sits at the highest coordinate and the numbering runs right to left, which is the whole reason this is a track and not a division by three. Roughly half the coding sequences in an annotation run backwards, and getting their numbering wrong is silent: the figure still draws, and names the wrong residue. Hand sequence the reference as it is; on the reverse strand the track complements and reverses the bases itself.
CodonTrack::new takes a 0-based, half-open span, so a GFF3 CDS 759807..763325 is CodonTrack::new(759_806, 763_325, strand). codon_of(position), span_of(codon) and residue_of(codon) convert in code. A trailing partial codon is left out, since a third of a residue is not a residue.
Translation is NCBI table 1, and table 11 gives the same residues, so bacteria, archaea and plastids need nothing more. A vertebrate mitochondrial or a ciliate sequence needs genetic_code, or it is translated into a plausible protein that is wrong. A codon whose bases were not supplied is drawn without a letter rather than guessed.
LegendTrack
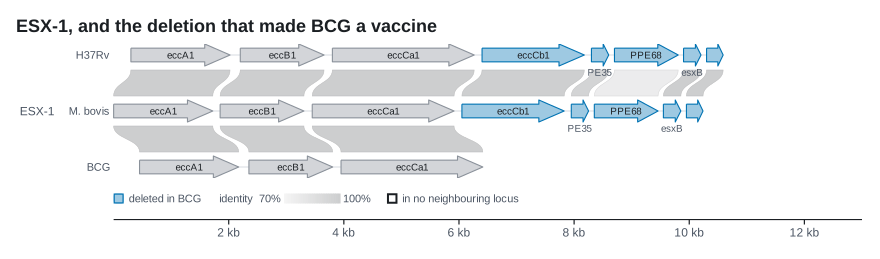
A key to the colours as a band of its own: filled squares, dots, lines, washed areas, outlines or a continuous ramp, laid across the figure and wrapped onto more rows when they run out of width.
| Rust | .add_legend(legend) on plot(); LegendTrack::new(legend) |
| Command line | drawn under the figure for the colours --traits and a tree's colour columns deal, each once; --no-legend leaves it out |
| Reads | nothing; build a Legend |
use karyon::{plot, Legend, Theme};

// loci: the LocusTrack the key explains
let (pale, dark) = loci.ramp_ends(&Theme::light());
let legend = Legend::new()
    .area("deleted in BCG", "#d55e00")
    .ramp("identity", pale, dark, "70%", "100%")
    .outline("in no neighbouring locus", "#1b1f23");

plot("ESX-1:1-13,000")?
    .add_track(loci)
    .add_legend(legend)
    .save("esx1.svg")?;
Options
On LegendTrack:
| Method | What it does | Default |
|---|---|---|
.label("key") |
Names the band in the left gutter | none |
On the Legend it draws:
| Method | What it does | Default |
|---|---|---|
.key("resistant", "#d55e00") |
A key drawn as a filled square | none |
.dot("sampled", "#0072b2") |
A key drawn as a point, for a series plotted as points | none |
.symbol("host", "#009e73", Symbol::Triangle) |
A key with an explicit point shape | none |
.line("mean depth", "#009e73") |
A key drawn as a stroke, for a series plotted as a line | none |
.area("gene family", "#0072b2") |
A key drawn washed and edged, the way a large filled shape is drawn | none |
.outline("unmatched", "#1b1f23") |
A key drawn as an empty square with an edge | none |
.marked("reads", "#0072b2", Marker::Dot) |
A key with its Marker named |
none |
.ramp("identity", pale, dark, "70%", "100%") |
A continuous scale between two colours, with its end labels | none |
.swatch(12.0) |
Size of one swatch, in pixels | 10 |
.gap(20.0) |
Space between one key and the next, in pixels | 16 |
Notes
A legend is a horizontal strip of the figure that carries no coordinates, which is exactly what a track is. Making it one means it stacks, clips and lays itself out like everything else, goes where you put it, and has room reserved for it, so it never lands on a corner that already has data in it.
Keys wrap onto another row when they run out of width, so the band's height depends on how wide the figure is. Nothing is ever dropped for want of room, because a key that is not drawn is worse than a legend two rows tall.
In Rust nothing builds a legend for you: which colours a reader needs explained is a judgement about the figure, not about a track. The command line takes that judgement for the colours it deals itself: every level and ramp that --traits and a tree's colour columns put on the figure is named in one key under the ruler, a colour used by two tracks named once, and so are the bases while they are blocks too narrow for their letters. --no-legend leaves the key out. In Rust, Figure::key() answers the second half: what each track needs explained at the zoom the figure is drawn at, a phylogeny's branch and strip colours among them, gathered into one Legend for a LegendTrack in the figure's own theme. A key should copy the mark it explains, which is what area and outline are for. Take a ramp's ends from the track that owns them, as LocusTrack::ramp_ends allows, so the key cannot drift from the ribbons; CopyNumberTrack::legend(&theme) and Traits::legend(&theme) hand you a finished Legend. A VariantTrack draws its own category key, which show_legend(false) turns off.