Annotation tracks
Draw what is annotated on a sequence: genes and other intervals, the transcription units that carry them, and the six reading frames with their stops.
The Rust snippets use ?, so they belong in a function that returns Result<(), Box<dyn std::error::Error>>, and names such as genes stand for data you already hold. To choose a track by its picture, start from the gallery.
FeatureTrack
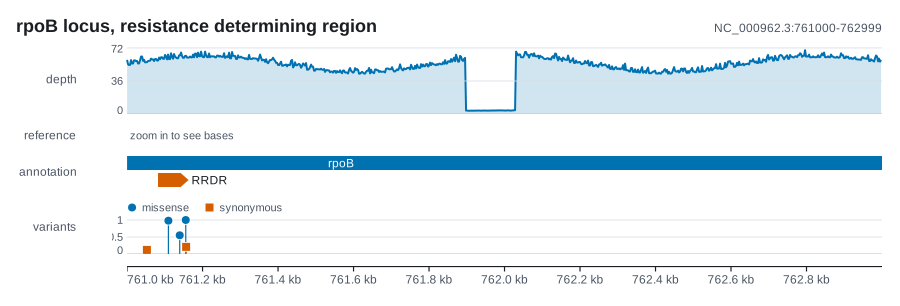
Annotated intervals from BED or GFF3, packed onto as few rows as they need without touching: genes, exons, repeats, primers. Strand is an arrowhead, and a feature's colour follows its strand unless you give it one.
| Rust | .add_features(features) on plot(); FeatureTrack::new(features) |
| Command line | --features FILE, with --row-height, --no-names, --color, --format |
| Reads | BED, GFF3 or GTF, told apart by their columns, with a gene drawn once rather than again for each transcript, exon and CDS (read::interval::features) |
use karyon::{plot, Feature, Strand};

plot("NC_000962.3:761,001-763,000")?
    .add_features(vec![
        // GFF3 759807..763325 is 0-based, half-open 759,806..763,325
        Feature::new(759_806, 763_325).name("rpoB").strand(Strand::Forward),
        Feature::new(761_081, 761_162).name("RRDR").color("#d55e00"),
    ])
    .label("genes")
    .save("genes.svg")?;
Options
| Method | What it does | Default |
|---|---|---|
.label("genes") |
Names the track in the left gutter (--label) |
none |
.row_height(18.0) |
Height of one row of features (--row-height) |
14 |
.row_gap(4.0) |
Gap between rows | 3 |
.color("#0072b2") |
Colour of features without one of their own (--color) |
the strand colour |
.show_names(false) |
Shows or hides feature names; hidden names pack tighter (--no-names) |
shown |
Notes
Features that would collide on screen go onto extra rows, and the track grows to fit them. Collisions are measured in pixels and include the room a name takes, so the same features take one row in a wide view and four in a narrow one, and only features in view are packed: a cluster off the left edge cannot push the gene on screen down a row.
The arrowhead takes a third of a short feature and never more than 8 pixels of a long one, so an interval stays a bar with a point on it. A feature's colour comes from Feature::color first, then the track's color, then strand_color, the one strand convention across the crate: a figure with a pileup two bands down would otherwise use one colour for forward in one band and for reverse in the next.
Feature::new(start, end) is 0-based and half-open, so a GFF3 line 759807..763325 is Feature::new(759_806, 763_325), and an end at or before the start is widened to one base. The reader converts for you; --format bed or --format gff3 overrides its guess when a file's columns could be either.
A feature is an interval and nothing more. It does not say that two genes are one molecule; that is a TranscriptionUnitTrack.
TranscriptionUnitTrack
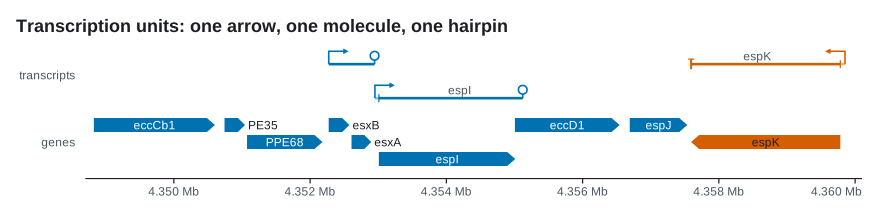
Where transcription starts, how far the 5' leader runs and where it stops: a bent arrow at the start site, a hollow leader, and a hairpin or a bar at the terminator. Use it above a FeatureTrack to say which genes are co-transcribed.
| Rust | .add_transcription_units(units) on plot(); TranscriptionUnitTrack::new(units) |
| Command line | none: library only, as no single standard table of transcription units exists to read |
| Reads | nothing from a file; build TranscriptionUnit values |
use karyon::{plot, Strand, Terminator, TranscriptionUnit};

let units = vec![
    TranscriptionUnit::new(4_349_000, 4_351_900, Strand::Forward)
        .cds_start(4_349_000) // leaderless: translation starts at the first base
        .terminator(Terminator::Intrinsic)
        .name("esxB-esxA"),
    TranscriptionUnit::new(4_356_400, 4_353_200, Strand::Reverse)
        .cds_start(4_356_330) // a 70 base leader
        .terminator(Terminator::RhoDependent),
];

// genes: Vec<Feature>, the genes the units carry
plot("NC_000962.3:4,348,701-4,360,100")?
    .add_transcription_units(units)
    .label("transcripts")
    .add_features(genes)
    .label("genes")
    .save("transcripts.svg")?;
Options
| Method | What it does | Default |
|---|---|---|
.label("transcripts") |
Names the track in the left gutter | none |
.row_height(36.0) |
Height of one row, which holds the bent arrow as well as the transcript | 30 |
.row_gap(8.0) |
Gap between rows | 6 |
.show_names(false) |
Shows or hides transcript names | shown |
.color("#0072b2") |
Overrides the colour | the strand colour |
Notes
The span is the claim. From the arrow to the terminator is one RNA molecule, so the genes under it are co-transcribed, and a promoter mutation upstream of the arrow changes all of them at once. This track draws only what a gene model cannot say; put a feature track under it for the genes.
TranscriptionUnit::new(tss, end, strand) anchors on the start site, so on the reverse strand tss is the higher coordinate. cds_start draws the leader hollow, which makes its length a distance you can measure against the ruler. A unit whose cds_start equals its tss is leaderless: no hollow segment, and the arrowhead lands flush on the start codon. leaderless() counts them, and how much of a collection is leaderless is often the observation the figure exists to make. A start codon on the wrong side of the start site is a contradiction, so leader() reads it as no leader rather than a negative one.
Terminator::Intrinsic draws a hairpin, Terminator::RhoDependent a plain bar, and Terminator::Unknown, the default, a plain tick, so a 3' end nobody has explained does not claim a mechanism.
The arrow and the terminator are a fixed size in pixels, so rows are packed with a margin in pixels around each unit, and the number of rows changes with the width of the view.
OrfTrack
The six reading frames of a stretch of sequence: three lanes above a line for the frames read left to right and three below for the other strand, each stop codon a tick and each open reading frame the bar between two of them. Use it to decide whether an unannotated stretch is coding, and which way round.

| Rust | .add_orfs(seq) or .add_orfs_at(start, seq) on plot(); OrfTrack::new(start, seq) |
| Command line | --orfs FILE, with --row-height |
| Reads | FASTA, its only record or the one named like the region's sequence, cut to the region: the same file --sequence takes (read::seq::fasta) |
Options
| Method | What it does | Default |
|---|---|---|
.label("frames") |
Names the track in the left gutter (--label) |
none |
.lane_height(12.0) |
Height of one frame lane (--row-height) |
9 |
.lane_gap(3.0) |
Gap between lanes | 2 |
.min_codons(50) |
Codons a run without a stop needs to count as open | 30 |
.require_start(true) |
Requires an open frame to begin at ATG, GTG or TTG |
off |
.colors(forward, reverse) |
Colours of the forward and reverse lanes | from the theme |
.show_frames(false) |
Shows or hides the frame numbers at the left of each lane | shown |
Notes
Open means a run of at least min_codons codons with no stop in it. Thirty is the floor because a stop turns up about every twenty-one codons in random sequence, so a lower one fills all six lanes with stretches open by chance.
Whether an open frame starts at a methionine is a separate question and a separate switch. require_start is off by default because the first thing a six-frame map is read for is where the stops are not, and a frame whose start lies off the left of the view is still open.
The frames are numbered against the sequence you hand over, not against the chromosome: frame -1 is read from the far end of that slice. Hand it the bases of the region on display, as --orfs does, and the reverse frames are those of what is on screen, which is what every ORF finder does. orfs() and stops() return the same findings as numbers.