Visual system
Karyon has one visual grammar for linear figures, circular plots and panel sheets. It separates three decisions that used to be mixed together:
Themeselects colours and typefaces.RenderProfileselects a named output treatment.VisualTokens,DensityandEmphasiscontrol measured geometry and semantic prominence.
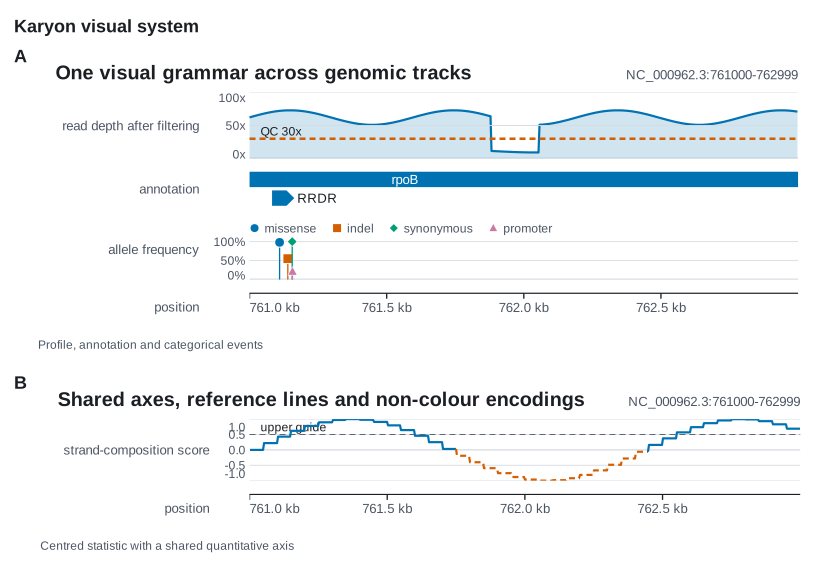
The figure is generated by cargo run --example visual_system -- assets.
Named profiles
use karyon::RenderProfile;

let figure = plot("chr1:1-10000")?
    .profile(RenderProfile::Manuscript)
    .add_coverage(depth)
    .into_figure();
Compact, Manuscript, Presentation, Web and Dark select type scale,
mark scale and data density together. The same profile method is available on
Plot, Figure, Rings and Panels. A later theme, visual_scale or
density call can override one part deliberately.
| Profile | Use |
|---|---|
Compact |
Dense multi-panel figures and narrow columns. |
Manuscript |
Balanced vector artwork for papers. |
Presentation |
Larger type and marks for projection. |
Web |
Slightly larger browser and documentation figures. |
Dark |
Manuscript geometry with the selected dark palette. |
Tokens and emphasis
Theme::tokens is a VisualTokens value shared by axes, guides, markers,
features and legends. It contains the ordinary and strong stroke widths,
marker radius, tick and arrow sizes, label and row gaps, feature height, legend
measurements and area opacity. Theme::scaled scales these values with the
font sizes and corner radius.
Emphasis is semantic rather than chromatic: Muted, Normal, Primary and
Alert. Theme::mark_style resolves it to stroke width, point size, opacity
and LinePattern. This keeps a threshold distinguishable when colour is
removed.
Shared quantitative axes
CoverageTrack, VariantTrack, ManhattanTrack and WindowTrack accept the
same QuantitativeAxis contract:
use karyon::{AxisFormat, Emphasis, QuantitativeAxis, ReferenceLine};

let axis = QuantitativeAxis::new()
    .range(0.0, 100.0)
    .ticks(3)
    .unit("x")
    .format(AxisFormat::Fixed(0))
    .reference(
        ReferenceLine::new(30.0)
            .label("QC 30x")
            .emphasis(Emphasis::Alert),
    );

let depth = CoverageTrack::new(start, values).axis(axis);
Pin the same range on figures that will be compared. AxisFormat::Auto uses
compact k and M suffixes; Fixed and Percent make the intended unit
explicit. Reference lines keep their exact labels and carry a pattern as well
as a colour.
Labels and legends adapt to space
Track gutters are measured from their content and capped. Long visible labels use an ellipsis while the document description retains the exact full track name. Figure headers fit around the locus label, and the exact title remains in the root SVG title.
Feature labels take part in row collision detection. Circular feature labels are fitted towards the centre and omitted when their text boxes collide; the feature arc still retains the exact name and coordinates in its tooltip.
Legends wrap rather than drop keys. A VariantTrack grows when a narrow plot
needs additional legend rows, and its legend copies the circle, square, diamond
or triangle used by each category.
Panels align the data, not the frames
Panels aligns the genomic plot origin of linear figures by default. A panel
with a long track label and a panel with no gutter therefore start their data
at the same sheet coordinate. Circular and free-form drawings have no linear
origin and keep their natural left edge.
Panels::new()
    .align_plot_areas(true)
    .push(&coverage, "A")
    .push(&variants, "B")
    .save_svg("comparison.svg")?;
Panels::visual_scale scales nested drawings that were already added, together
with letters, captions, gaps and margins.
Panels::row_major makes a regular comparison grid when rows carry meaning;
the default column-major flow remains the more compact choice for a long paper
figure with unequal panel heights.
Accessibility and exact content
The SVG root is named and described for assistive technology, and pointable
marks use exact <title> text. Categorical points cycle shape with colour;
thresholds and comparison lines use solid, dashed or dotted patterns. These
encodings improve greyscale printing and colour-vision accessibility without
changing positions, values, categories, labels or their order.
The CI example job regenerates every deterministic SVG and fails on stale
assets. It also rasterises the complete gallery and uploads the PNG set as the
visual-gallery artifact, so a visual review uses the same output that passed
the SVG gate.