Getting started
Installing mycolorsTB takes two commands rather than one, and the order
matters. The package imports ggtree, ggtree lives on Bioconductor, and
install.packages() only knows about CRAN. Skipping the first command does not
stop the second from reporting success, which is why the failure that follows is
hard to read.
1. Install ggtree, from Bioconductor
if (!requireNamespace("BiocManager", quietly = TRUE)) {
  install.packages("BiocManager")
}
BiocManager::install("ggtree")
BiocManager itself is on CRAN, so the first half is an ordinary install. It is
what teaches R where the Bioconductor repositories are, and BiocManager also
pins you to the Bioconductor release that matches your R version, which is the
part that goes wrong if you add the repository URL by hand.
What happens if you skip this step
Nothing, at first. install.packages("mycolorsTB") prints one warning among
the download chatter and then finishes normally:
Warning: dependency ‘ggtree’ is not available
The package is on disk and packageVersion("mycolorsTB") answers. The
failure arrives one line later, at load time, and names a package you never
asked for:
Error: package or namespace load failed for ‘mycolorsTB’ in loadNamespace(i, c(lib.loc, .libPaths()), versionCheck = vI[[i]]):
 there is no package called ‘ggtree’
Read literally, it looks like a broken installation of mycolorsTB.
Reinstalling it changes nothing, because the missing piece is ggtree.
Install ggtree as above and load the package again; mycolorsTB itself
does not need reinstalling.
2. Install mycolorsTB
install.packages("mycolorsTB")
This is version 0.1.1, and it is the one you get unless you go out of your way.
install.packages("remotes")
remotes::install_github("PathoGenOmics-Lab/mycolorsTB")
This is version 0.1.2 from the main branch, which has not been
submitted to CRAN yet. It installs from source, but the package is pure R
with nothing to compile, so no toolchain is needed. It will try to install
any dependency you are missing, which is one more reason to do step 1
first.
3. Check which one you have
The two versions disagree about enough that a reader following these pages needs to know which is installed:
packageVersion("mycolorsTB")
| 0.1.1, on CRAN | 0.1.2, on main |
|
|---|---|---|
tb_palette(5, "mycolors") |
interpolates: #D1AE00 #FF81C8 #C40569 #C3EB10 #8FBDA1, colours belonging to no lineage |
returns the first five palette colours unchanged: #d1ae00 #8ef5c8 #73c2ff #ff9cdb #ff3091 |
scale_fill_mycolors(name = "Lineage") |
fails with unused argument (name = "Lineage"), because the scales take none |
the argument reaches ggplot2::scale_fill_manual() |
tb_palette(3, 2) |
returns three colours, having silently picked a palette by position | stops with palette_name must be a single palette name |
tb_palette(2.5) |
rounds silently and returns three colours | stops with n must be a single non-negative whole number |
view_palette("pathogenomics") |
writes every hex code in black, so #020203 is unreadable on its own swatch |
writes each code in black or white by the luminance of its swatch |
plot_tb_tree("not a tree") |
warns, then returns a plot with an empty axis | stops with newick_text could not be parsed as a single tree in Newick format |
Everything on these pages is written against 0.1.2. Where 0.1.1 differs, the table above says how, and the changelog lists the rest.
4. A first plot
The quickest check that the install worked needs no data at all, because the package can draw its own palette:
library(mycolorsTB)

view_palette("mycolors")
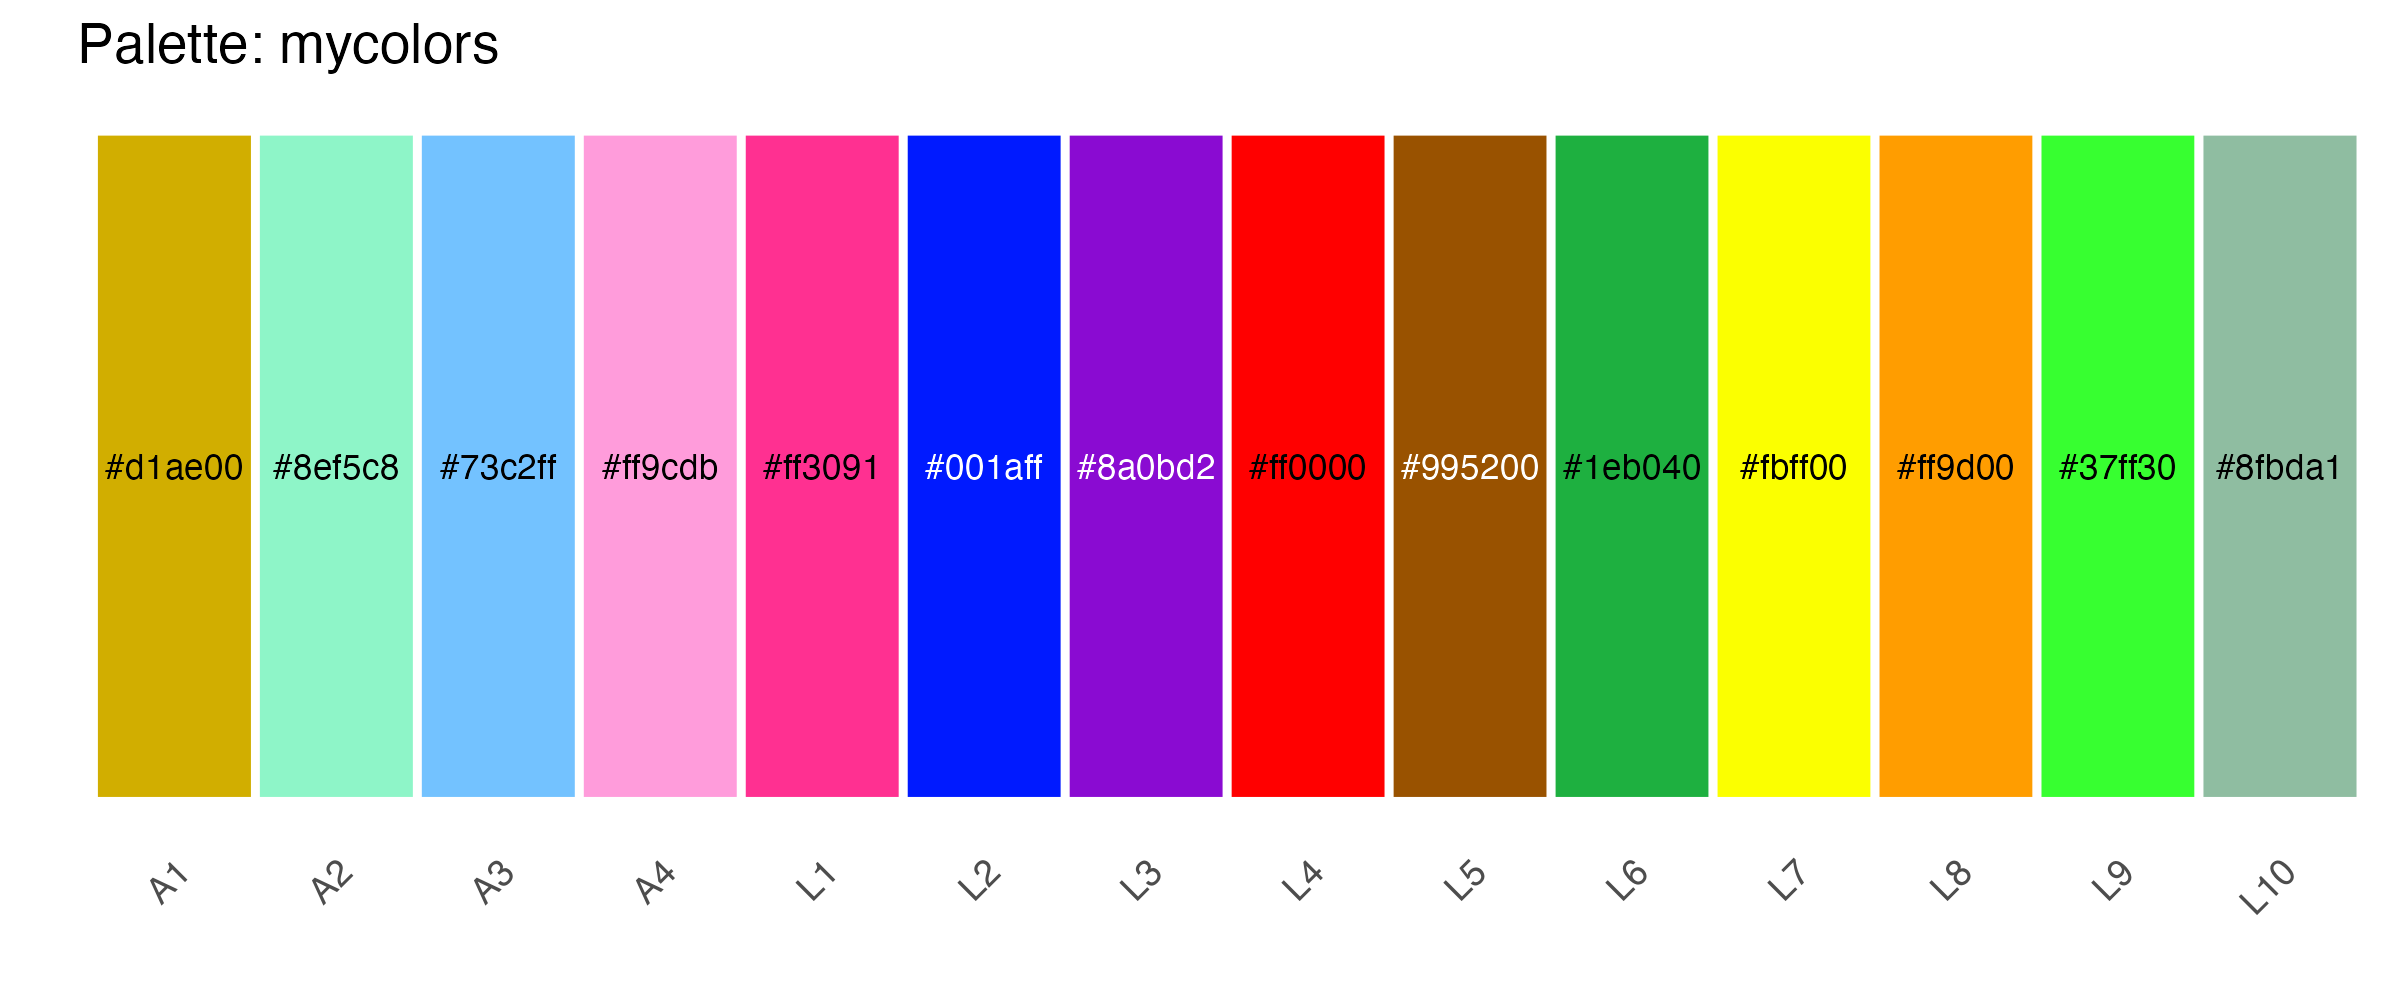
Then the thing you actually came for, a ggplot2 scale. Give your groups the
lineage names and add one line:
library(ggplot2)

lineages <- data.frame(
  lineage = factor(names(mycolors), levels = names(mycolors)),
  isolates = c(3, 5, 4, 2, 41, 58, 22, 96, 13, 74, 6, 9, 4, 2)
)

ggplot(lineages, aes(x = lineage, y = isolates, fill = lineage)) +
  geom_col() +
  scale_fill_mycolors(name = "Lineage") +
  labs(x = NULL, y = "Isolates") +
  theme_minimal()
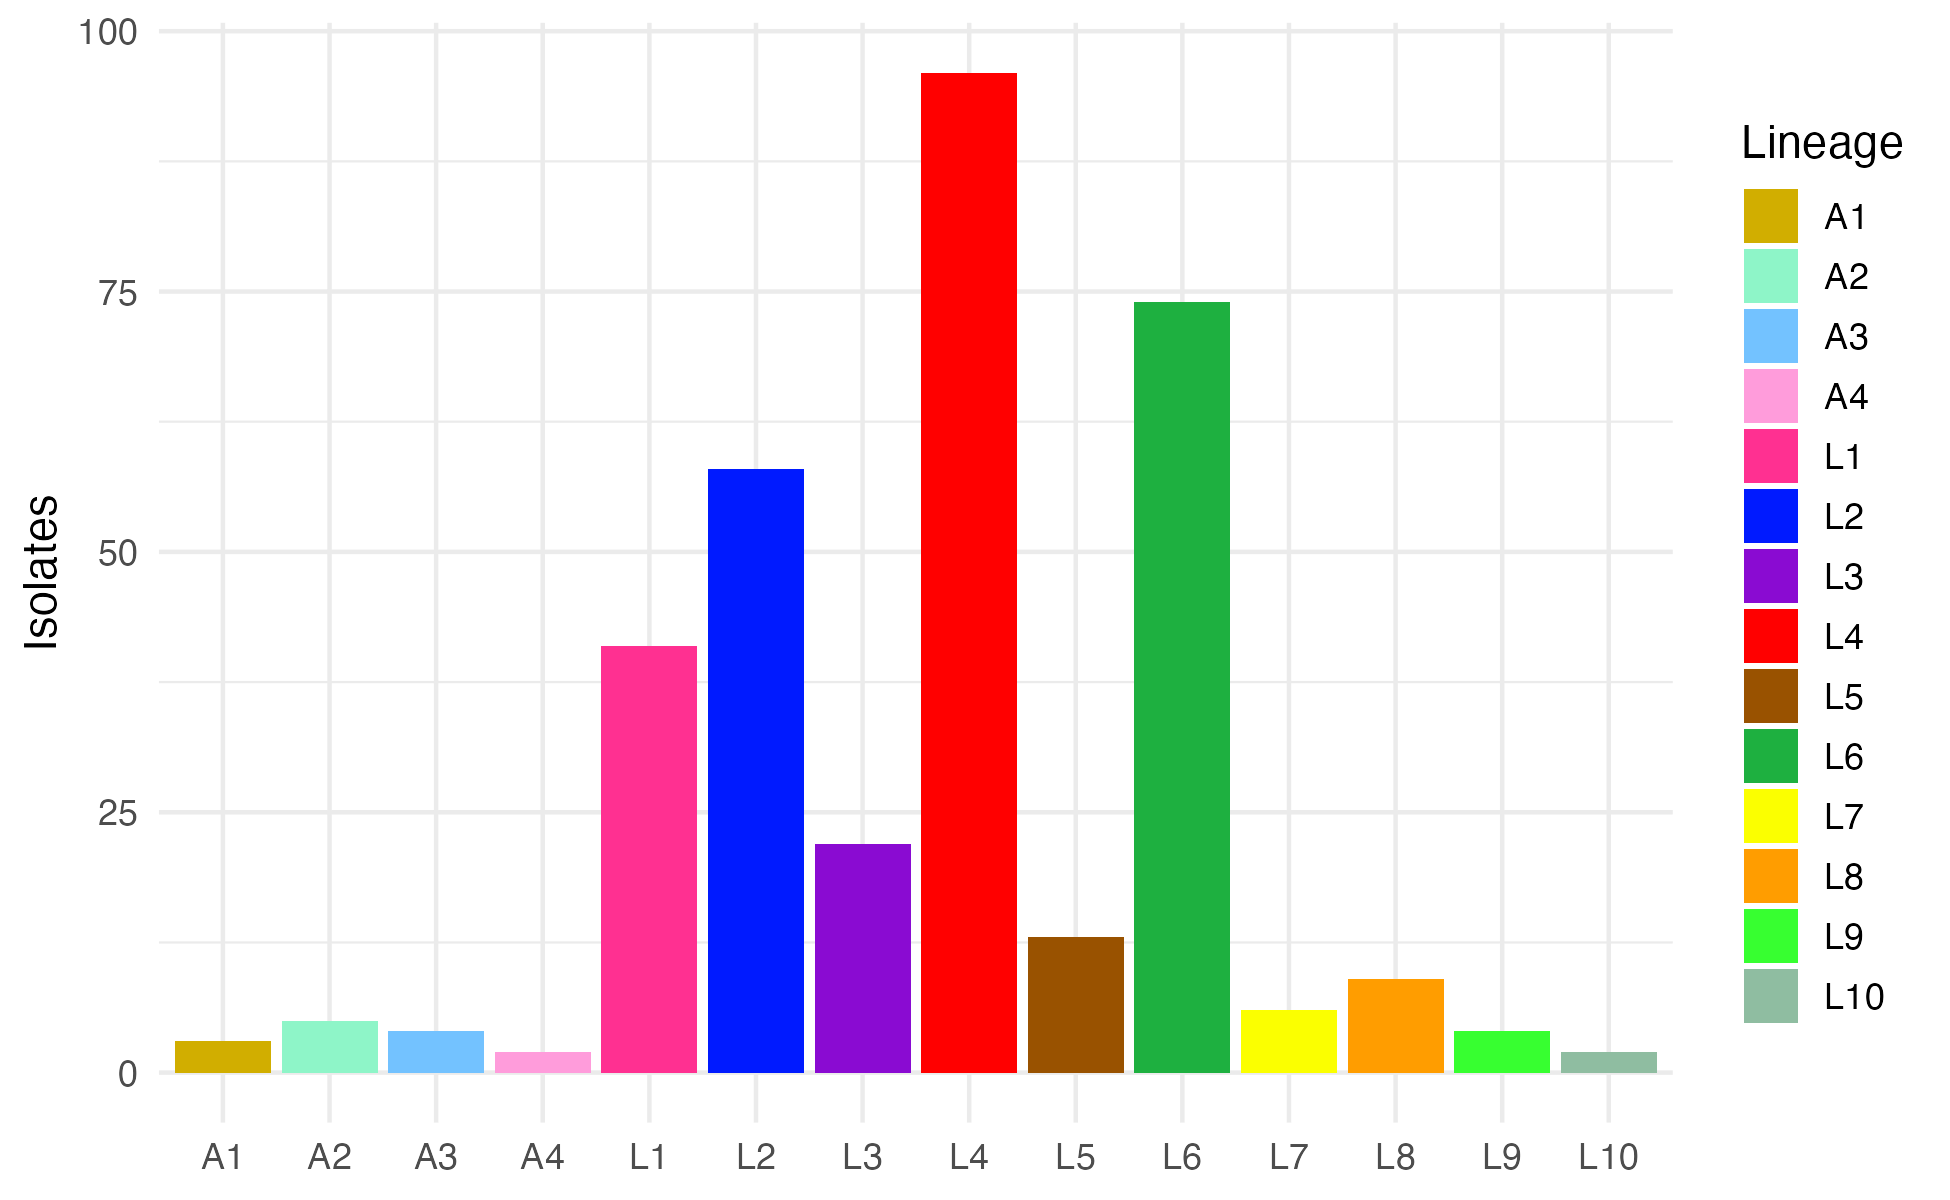
The factor(..., levels = ...) is not decoration. Without it R sorts the
lineage names alphabetically and L10 lands between L1 and L2. The colours
still follow their lineages, because the scale matches by name, but the axis
reads in an order nobody expects.
name needs 0.1.2
scale_fill_mycolors(name = "Lineage") is an error on the CRAN release,
which accepts no arguments at all. On 0.1.1, drop it and rename the legend
with labs(fill = "Lineage") instead.
Where to go next
- Palettes: the three palettes, when to match by name and when to match by position, and how the fourteen colours hold up under colour vision deficiency.
- ggplot2 scales: the four scale functions, and what they forward
to
ggplot2. - Trees and cladograms:
plot_tb_tree()andplot_tb_cladogram(), which are the reasonggtreeis a dependency at all. - Function reference: every export, one entry each.
- Troubleshooting: including the
is.waive()error that an oldggtreethrows when it meetsggplot24.x, which looks like a bug in this package and is not.