mycolorsTB
Fourteen colours, one per lineage of the Mycobacterium tuberculosis complex,
wired into ggplot2 and ggtree so that L4 is the same red in figure 1 and in
figure 7, in your plots and in your collaborators'.
Who it is for
Anyone plotting lineage-typed M. tuberculosis data: the output of a lineage
caller, a phylogeny with lineage-labelled tips, a resistance table broken down
by lineage. The problem the package solves is small and constant. Every figure
in a manuscript picks its own colours, a reviewer asks whether the green in
figure 2 is the green in figure 4, and nobody can say. mycolorsTB fixes one
colour per lineage and hands it to ggplot2 as a scale, so the answer stops
depending on which plot you wrote last.
A first plot
Fourteen isolate counts, one bar per lineage:
library(mycolorsTB)
library(ggplot2)

lineages <- data.frame(
  lineage = factor(names(mycolors), levels = names(mycolors)),
  isolates = c(3, 5, 4, 2, 41, 58, 22, 96, 13, 74, 6, 9, 4, 2)
)

ggplot(lineages, aes(x = lineage, y = isolates, fill = lineage)) +
  geom_col() +
  scale_fill_mycolors(name = "Lineage") +
  labs(x = NULL, y = "Isolates") +
  theme_minimal()
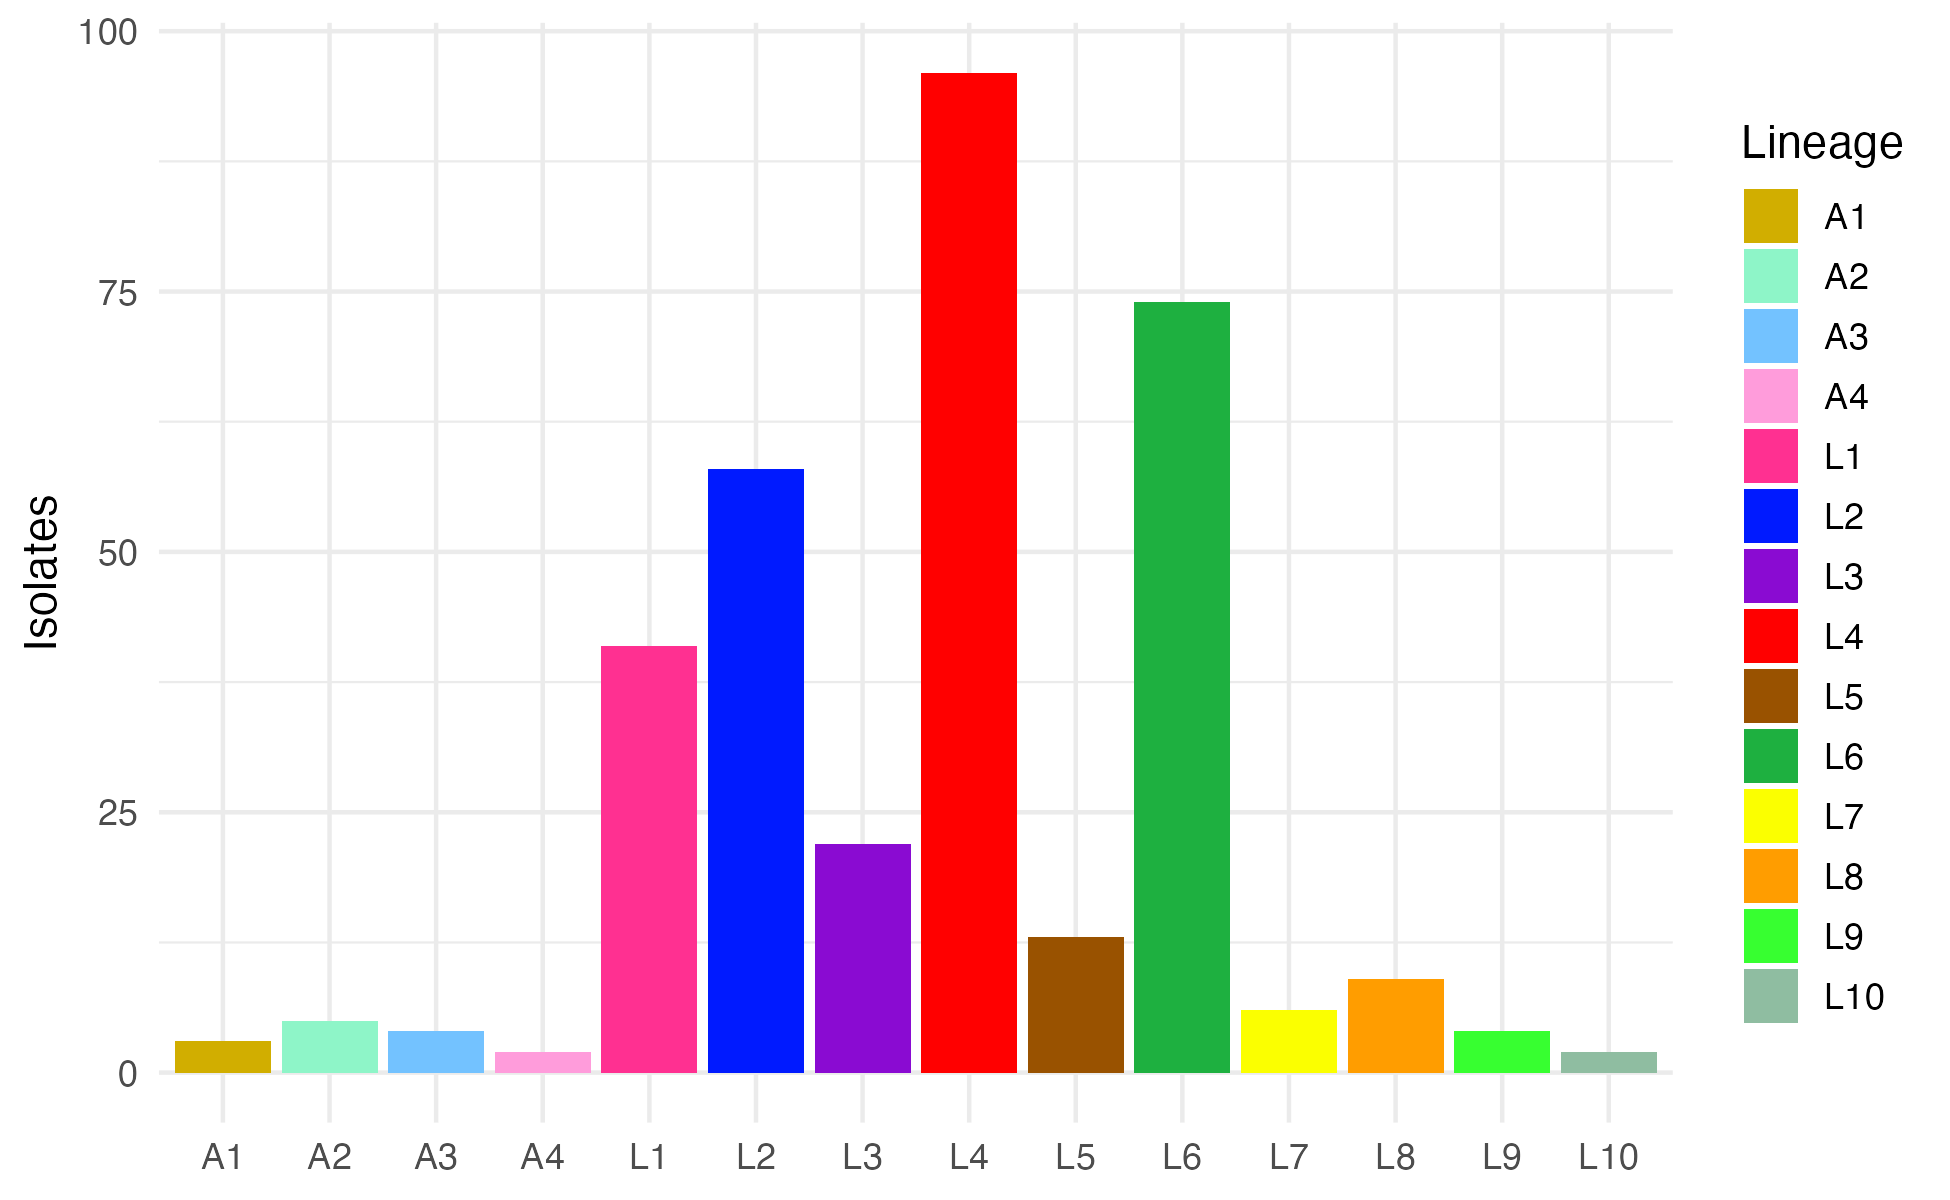
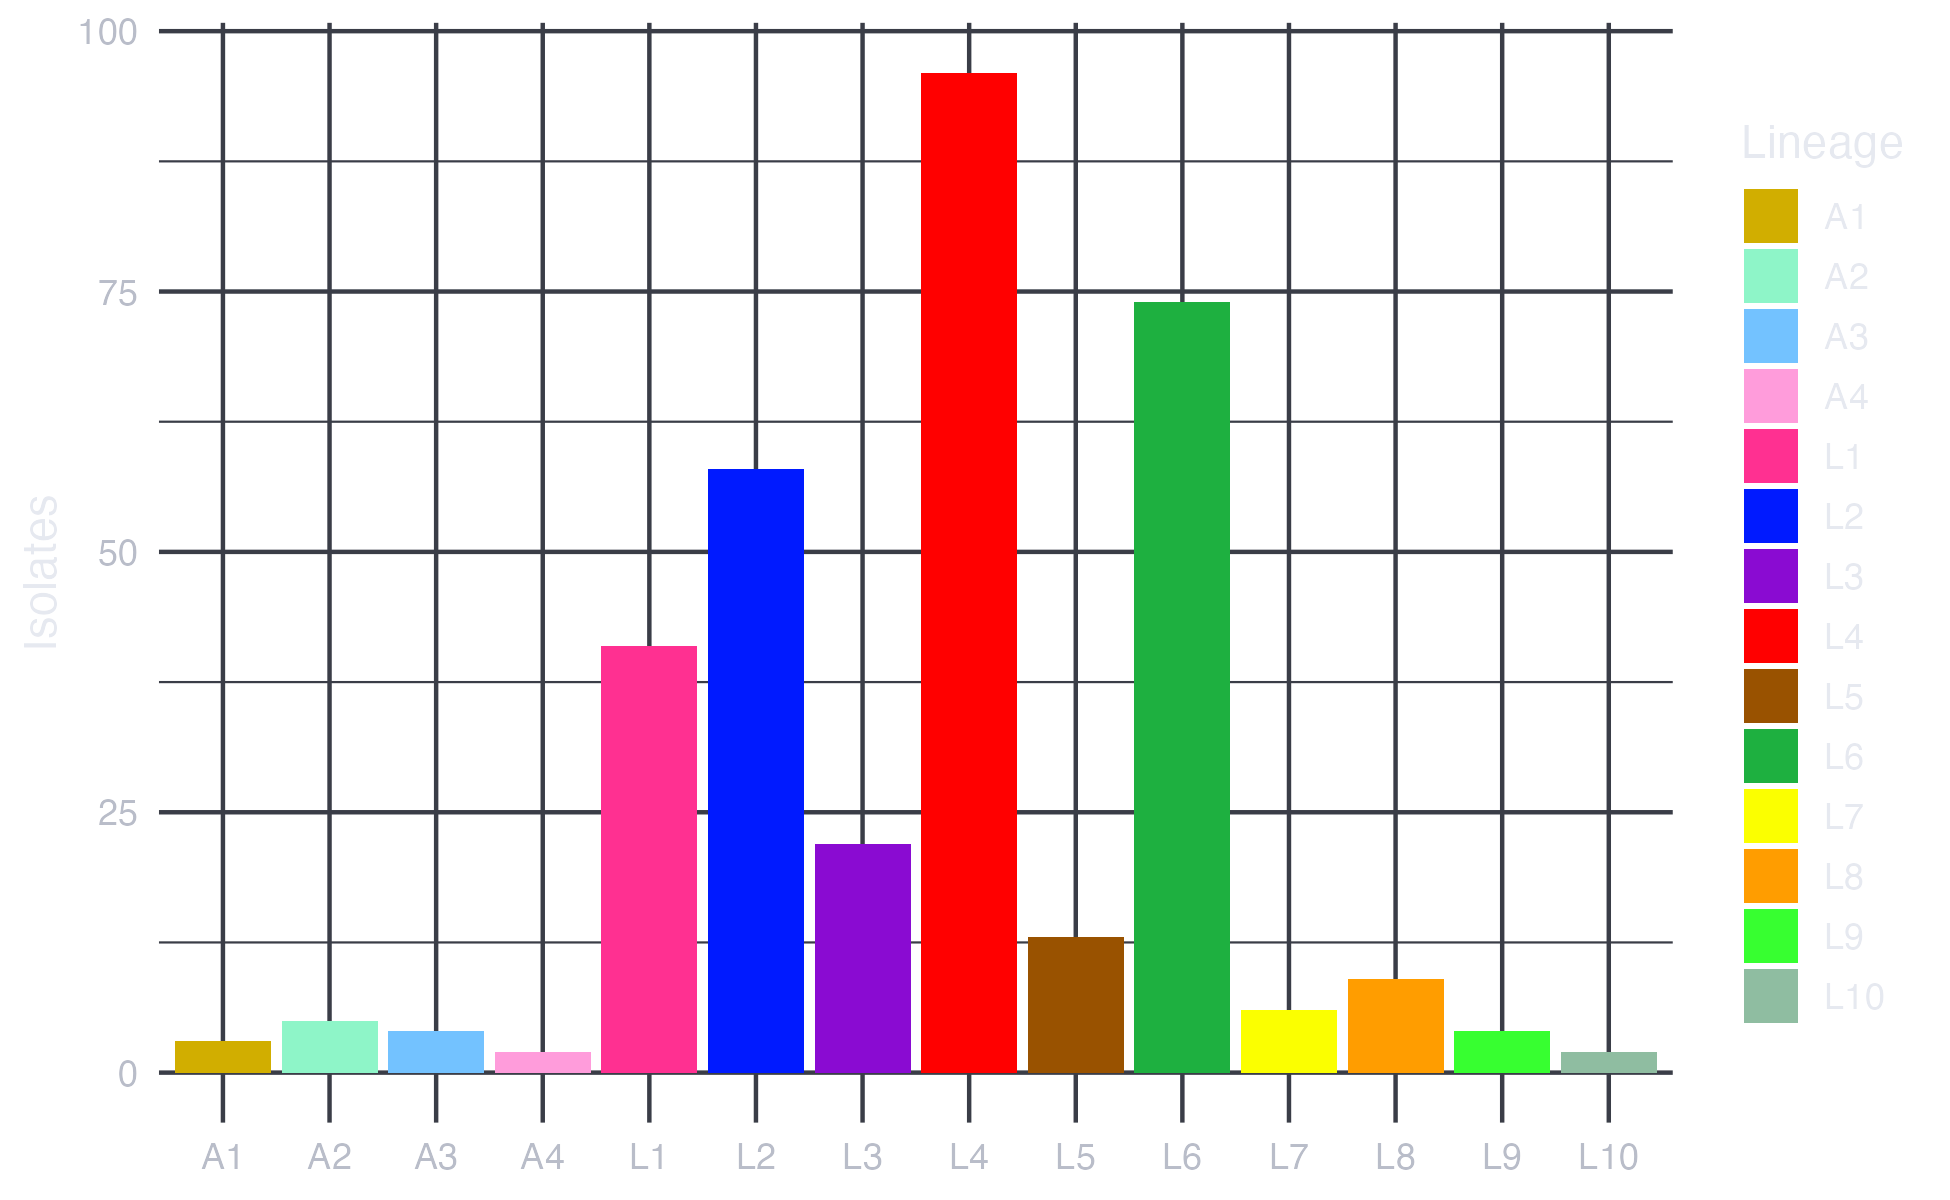
These pages document 0.1.2; CRAN ships 0.1.1
The block above needs 0.1.2, which is on main and not yet submitted. On the
CRAN release the scales take no arguments at all, so
scale_fill_mycolors(name = "Lineage") fails with
unused argument (name = "Lineage"). Drop the argument and name the legend
from labs() instead:
scale_fill_mycolors() +
  labs(x = NULL, y = "Isolates", fill = "Lineage")
packageVersion("mycolorsTB") tells you which one you have, and
Getting started sets the two
versions side by side.
That is the whole interface for the common case: name your groups after the lineages and add one scale. Nothing else in the plot changes.
One dependency does not come from CRAN
install.packages("mycolorsTB") installs the package but not ggtree,
which lives on Bioconductor. The install still reports success and the
failure only arrives at library().
Getting started covers the order to install things in.
What is in the package
| Palettes | mycolors, classicTB, pathogenomics |
| ggplot2 scales | scale_color_mycolors(), scale_fill_mycolors(), scale_color_classicTB(), scale_fill_classicTB() |
| Palette tools | view_palette(), tb_palette() |
| Tree helpers | plot_tb_tree(), plot_tb_cladogram() |
The one thing to get right
mycolors and classicTB hold the same fourteen colours. mycolors is
named by lineage, so a scale built from it matches your data by label:
a group called L4 gets L4's red wherever it appears, and a group whose label
is not a lineage name gets the scale's na.value instead of a colour. It does
not error, so an unmatched label is easy to miss. classicTB is the same
colours unnamed, so the scale hands them out in order and works for any
categorical variable that has nothing to do with lineages.
Which one you want depends entirely on whether your categories are lineages. Palettes works through both, with the failure modes.
Where to go next
-
Getting started
Installing
ggtreefrom Bioconductor first, then the package, then a plot that works. Also how to tell which version you have. -
Palettes
All fourteen colours with their hex codes, when to use names and when to use positions, and what the palette looks like to a colour blind reader.
-
ggplot2 scales
The four scale functions in use, what they forward to
ggplot2, and what happens when a group has no colour waiting for it. -
Trees and cladograms
plot_tb_tree()andplot_tb_cladogram(), and why the tip labels have to be lineage names. -
Function reference
All eleven exports, one entry each, with what they return and what they reject.
-
Troubleshooting
Grey bars, a missing
ggtree, and theis.waive()error that has nothing to do with this package.
Licence
mycolorsTB is released under the GPL-3 licence. It is written and
maintained by Paula Ruiz-Rodriguez at the PathoGenOmics Lab, I²SysBio,
University of Valencia-CSIC.