Benchmarks
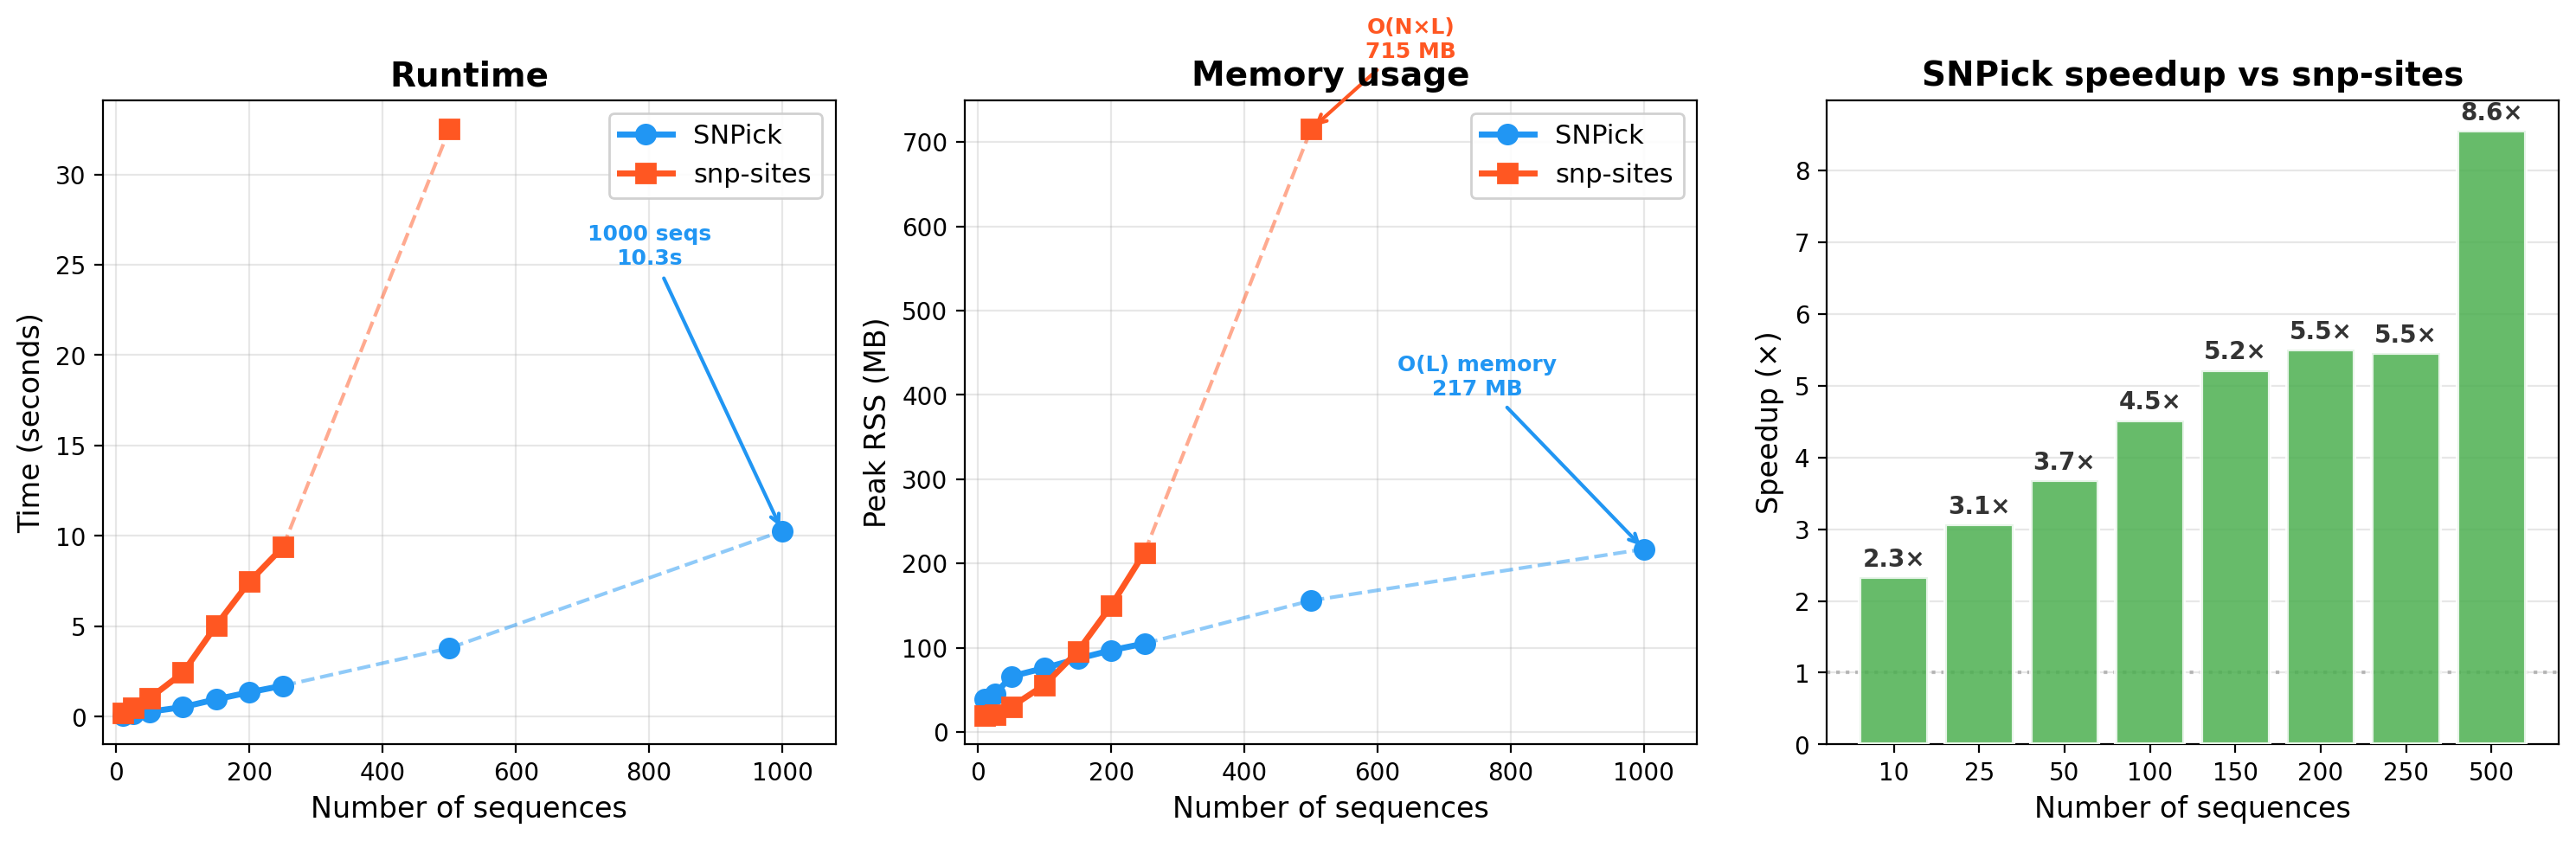
Benchmarks use simulated M. tuberculosis-like genomes (4.4 Mbp, ~65% GC, 3.6% variable sites). The figures below are the committed run in benchmarks/results.tsv; absolute wall-clock and peak memory depend on the host CPU and thread count.
Scaling by number of sequences
Scaling by sequence length
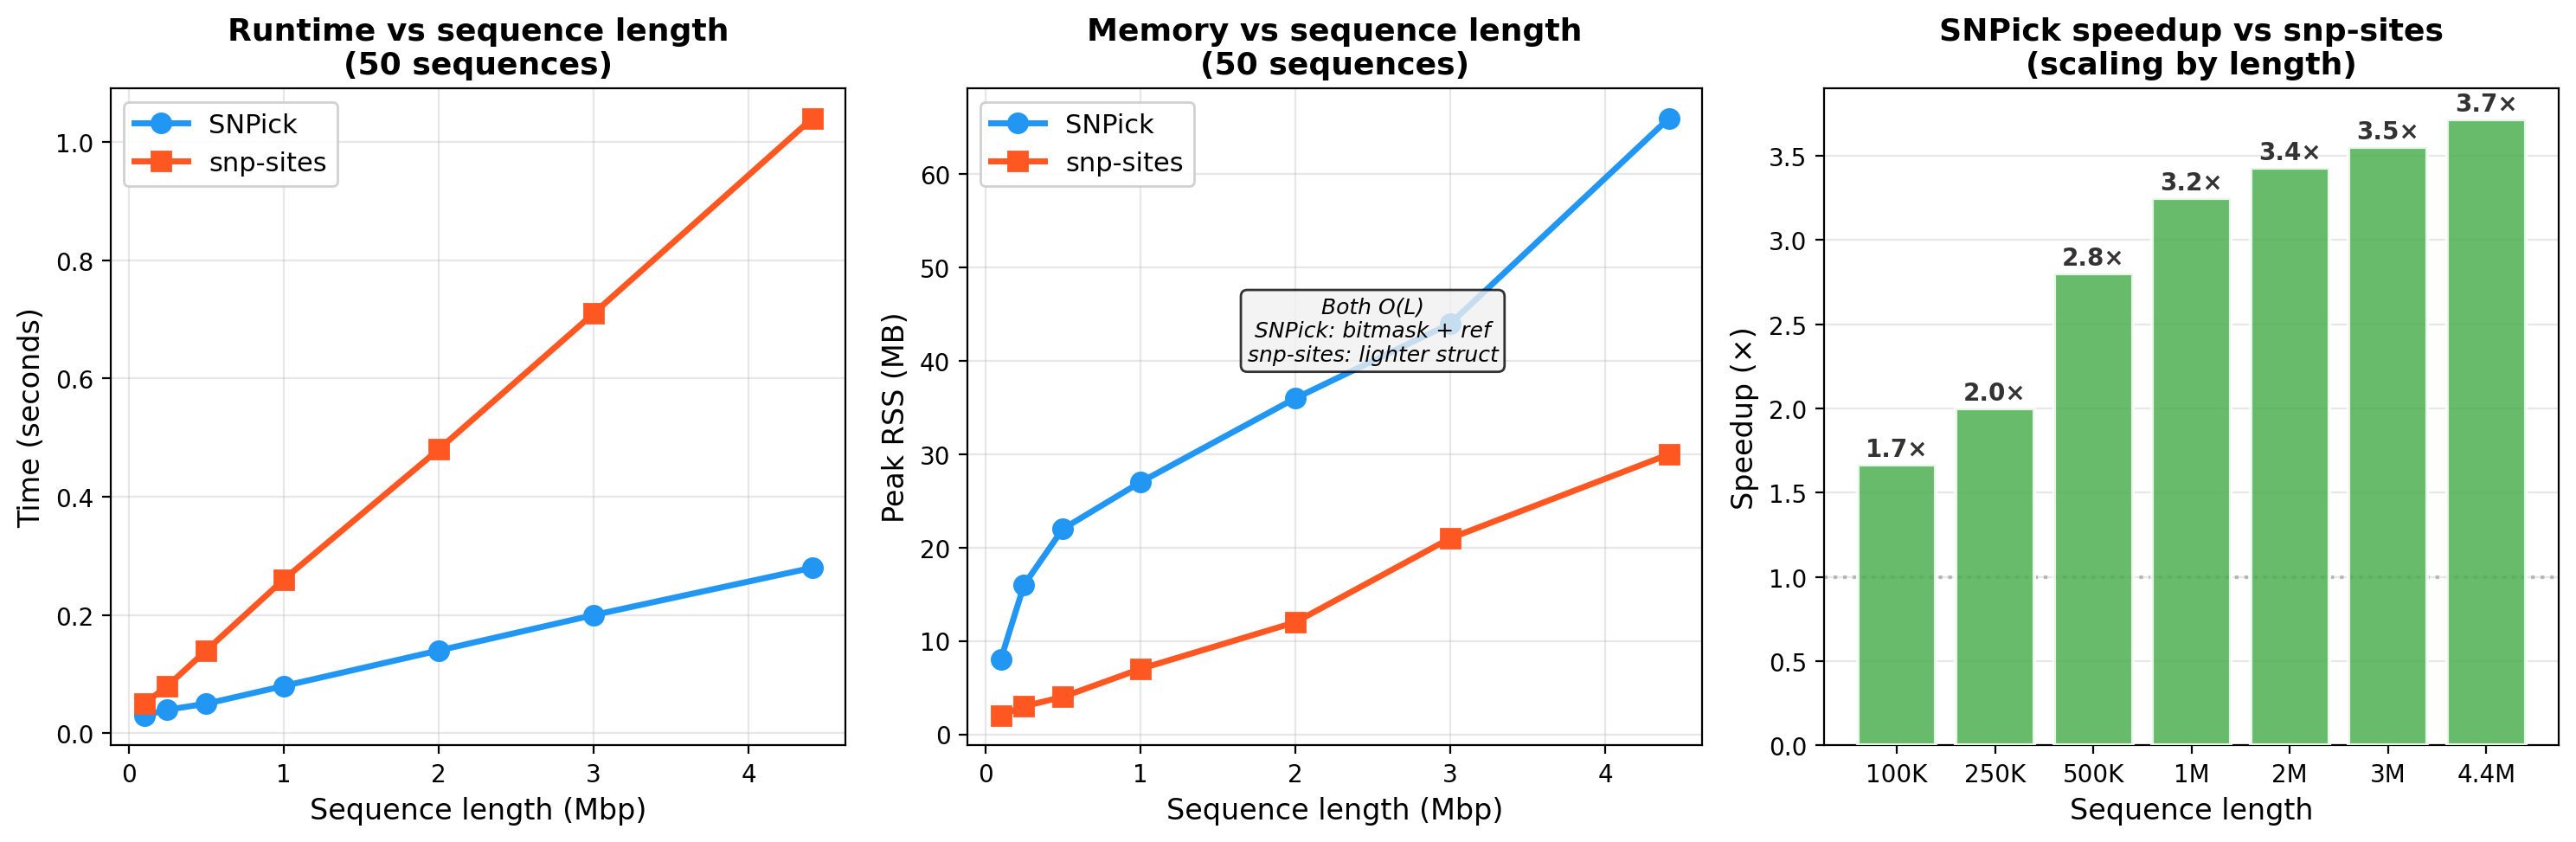
SNPick's memory grows far more slowly than snp-sites' O(N × L): snp-sites holds the full matrix in memory and is eventually killed on large inputs, while SNPick's footprint rises only gently with sequence count (≈39 MB at 10 sequences up to ≈217 MB at 1000).
| Dataset | SNPick | snp-sites |
|---|---|---|
| 250 seqs × 4.4 Mbp | 1.72 s, 105 MB | 9.38 s, 213 MB |
| 1000 seqs × 4.4 Mbp | 10.27 s, 217 MB | killed (OOM) |
Reproducing
Wall-clock depends on core count; pin it with --threads for comparable runs. The extracted sites and VCF are identical regardless of thread count.